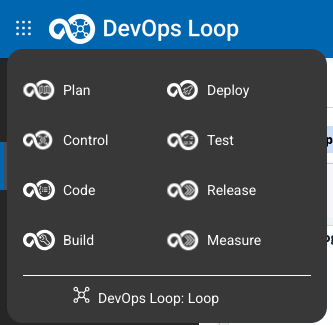
Classic Demo Flow Overview This Step by Step Demo Guide will give you compact Instructions how to demo DevOps Loop. For more detailed information about the Capabilities and Steps links to the indepth enablement Guide has been added.
Starting with Loop and Plan
flowchart LR
    subgraph LoopPlan [" "]
        direction LR
        Loop["🔄 <a href='#loop'>**Loop**</a><br/><br/>• Show Home Page <br/>• Short intro Dashboards and metrics"]
        Plan["📋 <a href='#plan'>**Plan**</a><br/><br/>• Show a kanban board<br/>• Work with filters<br/>• Workitems and Details<br/>• Show Plan AI assistant"]
    end


    Loop --> Plan
    %%Plan --> Control


    style Loop fill:#e1f5ff,text-align:left
    style Plan fill:#f3e5f5,text-align:left
Proceeding to Control and Code
flowchart LR
    subgraph ControlCodeControl [" "]
        direction LR
        Control["🎛️ <a href='#control-work-with-repository'>**Control**</a><br/><br/>• Show repo in Control<br/>• Open repo with DevOps Code<br/>• Select a dev Container <br/>• Proceed with Code"]
        Code["💻 <a href='#code'>**Code**</a><br/><br/>• Change some code<br/>• Push code and add commit to work item number"]
        Control2["🎛️ <a href='#control'>**Control**</a><br/><br/>• Show activity report<br/>• Show git commit details"]
    end


    Control --> Code
    Code --> Control2


    style Control fill:#e8f5e9,text-align:left
    style Control2 fill:#e8f5e9,text-align:left
    style Code fill:#fff3e0,text-align:left
Now building and deploying with Build and Deploy
flowchart LR

    subgraph BuildDeploy [" "]
        direction LR
        Build["🔨 <a href='#build'>**Build**</a><br/><br/>• Show Build Runs and details<br/>• Show Build Templates"]
        Deploy["🚀 <a href='#deploy'>**Deploy**</a><br/><br/>• Deploy Overview<br/>• Run Deployment<br/>• Show Genie<br/>• Show Plug-Ins"]
    end

    Build --> Deploy

    style Deploy fill:#f1f8e9,text-align:left
    style Build fill:#fce4ec,text-align:left
Run Tests and Show progress with Test and Measure
flowchart LR

    subgraph TestMeasure [" "]
        direction LR
        Test["✅ <a href='#test'>**Test**</a><br/><br/>• Show Test Home Page<br/>• Run a test<br/>• Show Results<br/>• Show Test Editor<br/>• Show Test Data generation"]
        Measure["📊 <a href='#measure'>**Measure**</a><br/><br/>• Show Pipeline view<br/>• Set a Gate<br/>• Show VSM"]
    end

    Test --> Measure

    style Test fill:#e0f2f1,text-align:left
    style Measure fill:#ede7f6,text-align:left
Manage Releases and use AI with Release and Loop Genie
flowchart LR
subgraph ReleaseGenie [" "]
direction LR
Release["📦 <a href='#release'>**Release**</a><br/><br/>• Show Release View and Calendar<br/>• Show Detail of a Release"]
Genie["🧞 <a href='#loop-genie'>**Loop Genie**</a><br/><br/>• Show Loop Genie<br/>• Prompt for information"]
end
Release --> Genie
style Release fill:#fff8e1,text-align:left
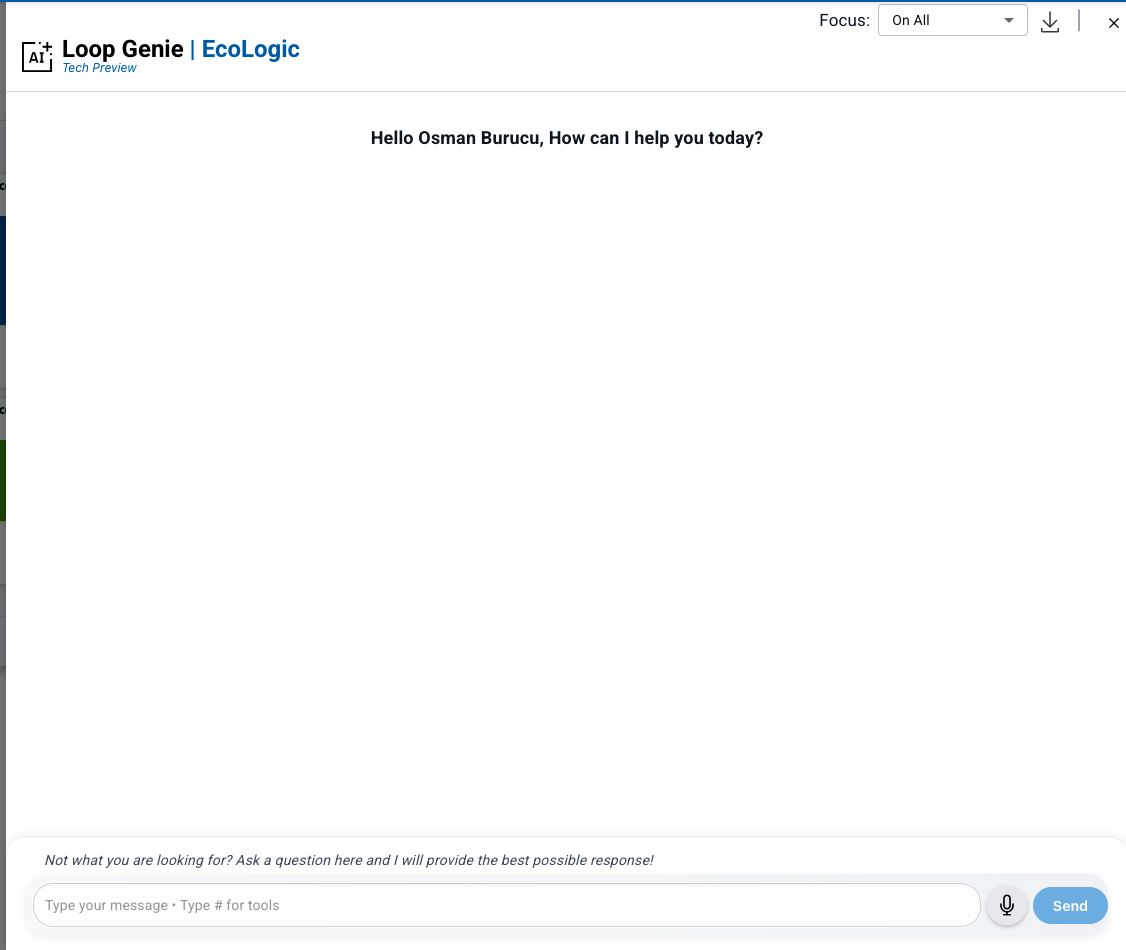
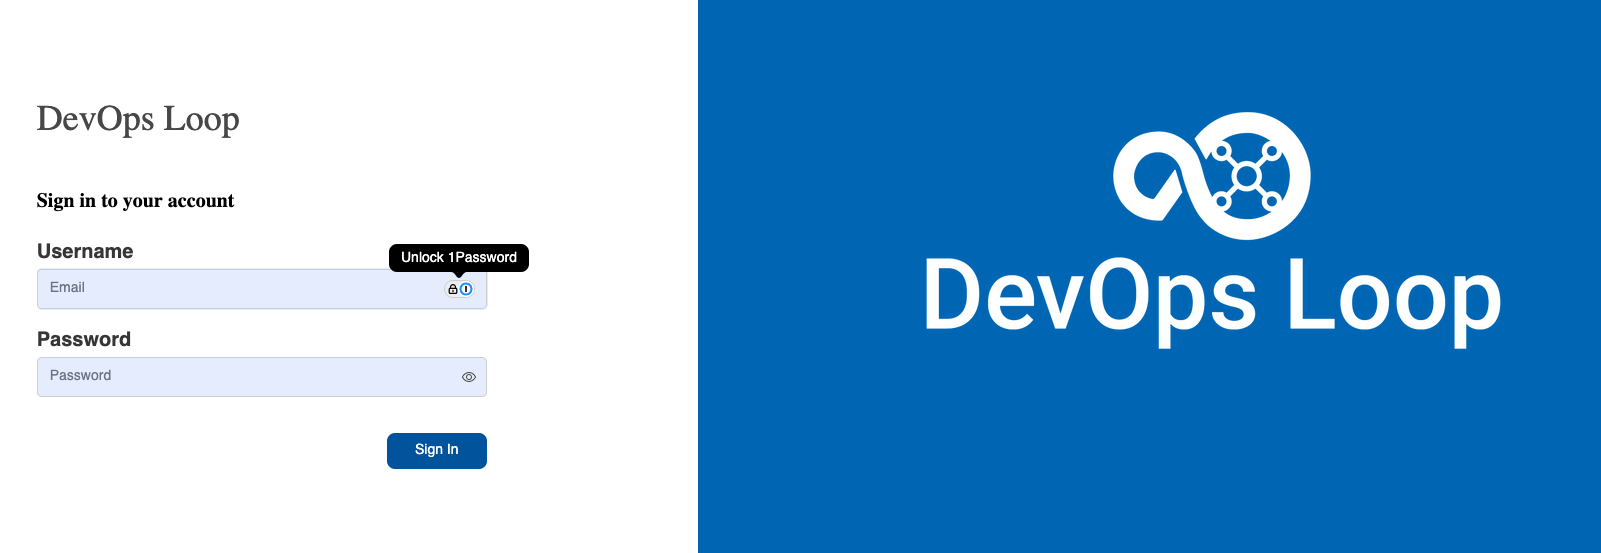
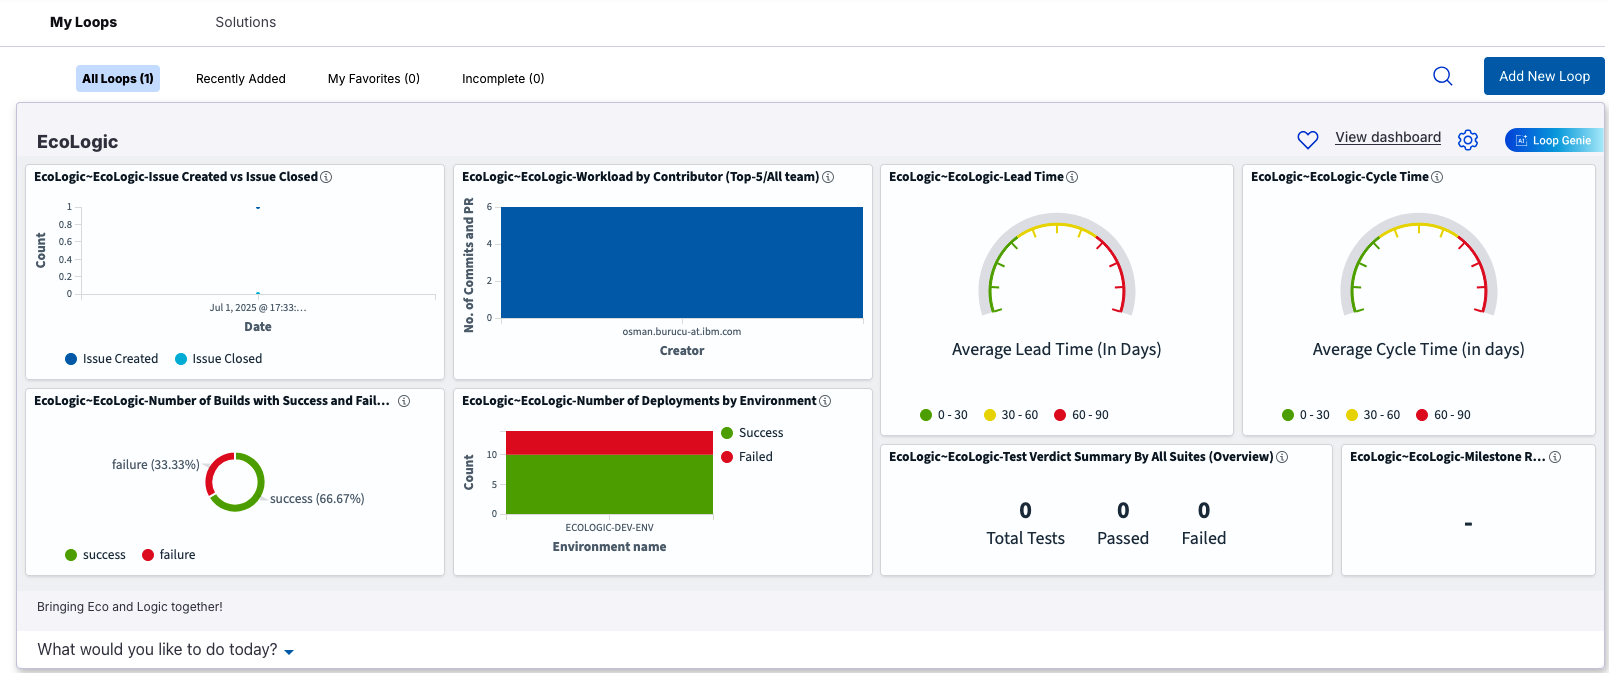
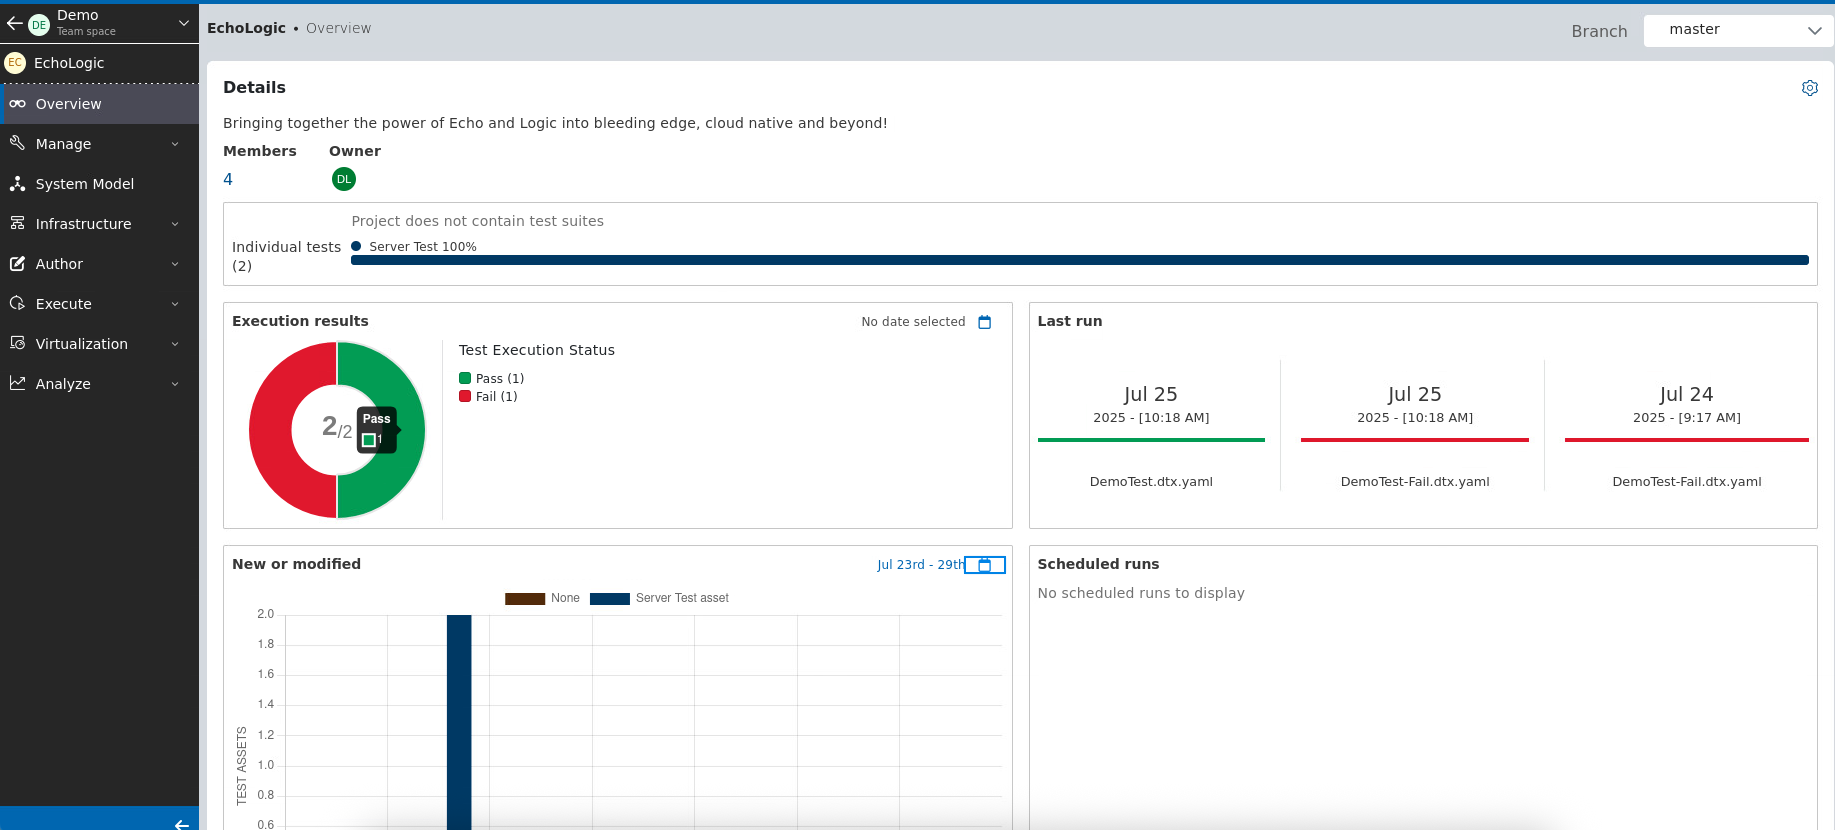
style Genie fill:#f3e5f5,text-align:leftLogin into Loop The Home Page Step Details Additional Information 1 After you have been logged in you will be directed to your homepage 2 If no Teamspace or Loop has been created follow: Creation of a Teamspace and Loops instructions 3 if a Teamspace and Loop exists it will provide you an overview about metrics from your Loops 4 To switch between Teamspaces follow this guide: Switching between Teamspaces
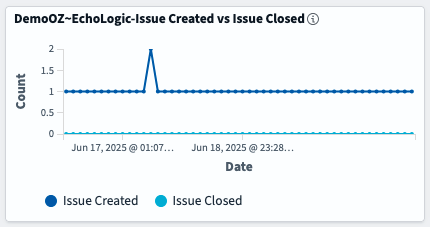
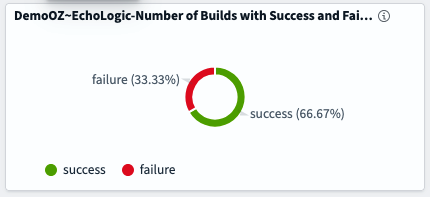
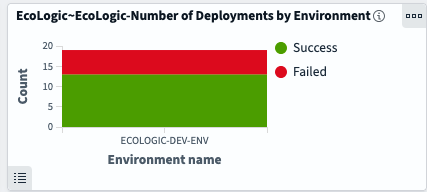
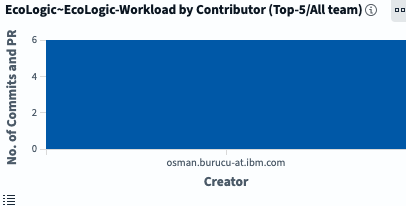
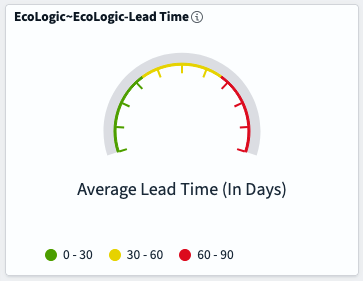
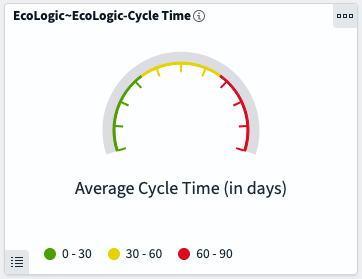
Dashboards and Metrics Step Details Additional Information 1 The Home Page provides metrics and dashboards over all of accessible Loops 2 Showing data from Plan - Ratio of Issues created versus closed 3 Number of Build Jobs failed and successful finished 4 Count of Deployments and how many of them were successfull or failed 5 Top contributors in Control 6 Two DORA (DevOps Research and Assessment) metrics for 6.1 Lead Time: In general, lead-time reflects the time from the start of a project until its final disposition 6.2 Cycle Time: In general, cycle-time reflects the time project elements take to resolve or complete 6.3 Find out more about DORA Metrics here
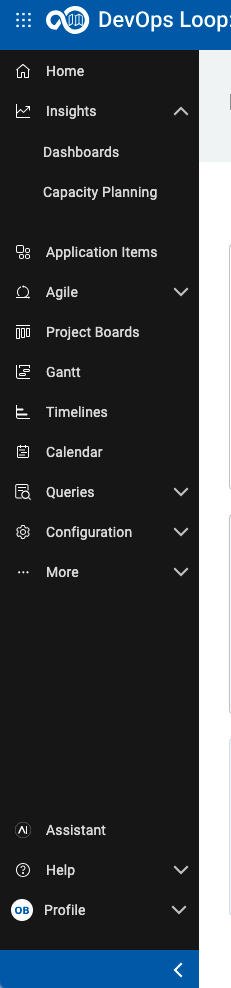
Plan Overview Step Details Additional Information 1 You can always switch using the central app switcher on the top left of your screen 2 Or You can switch directly to Plan by using the button/link from What would you like to do today section
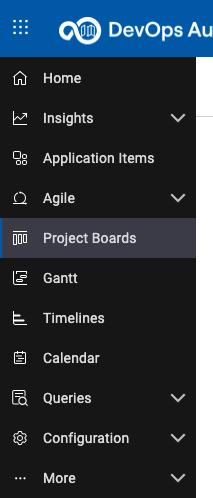
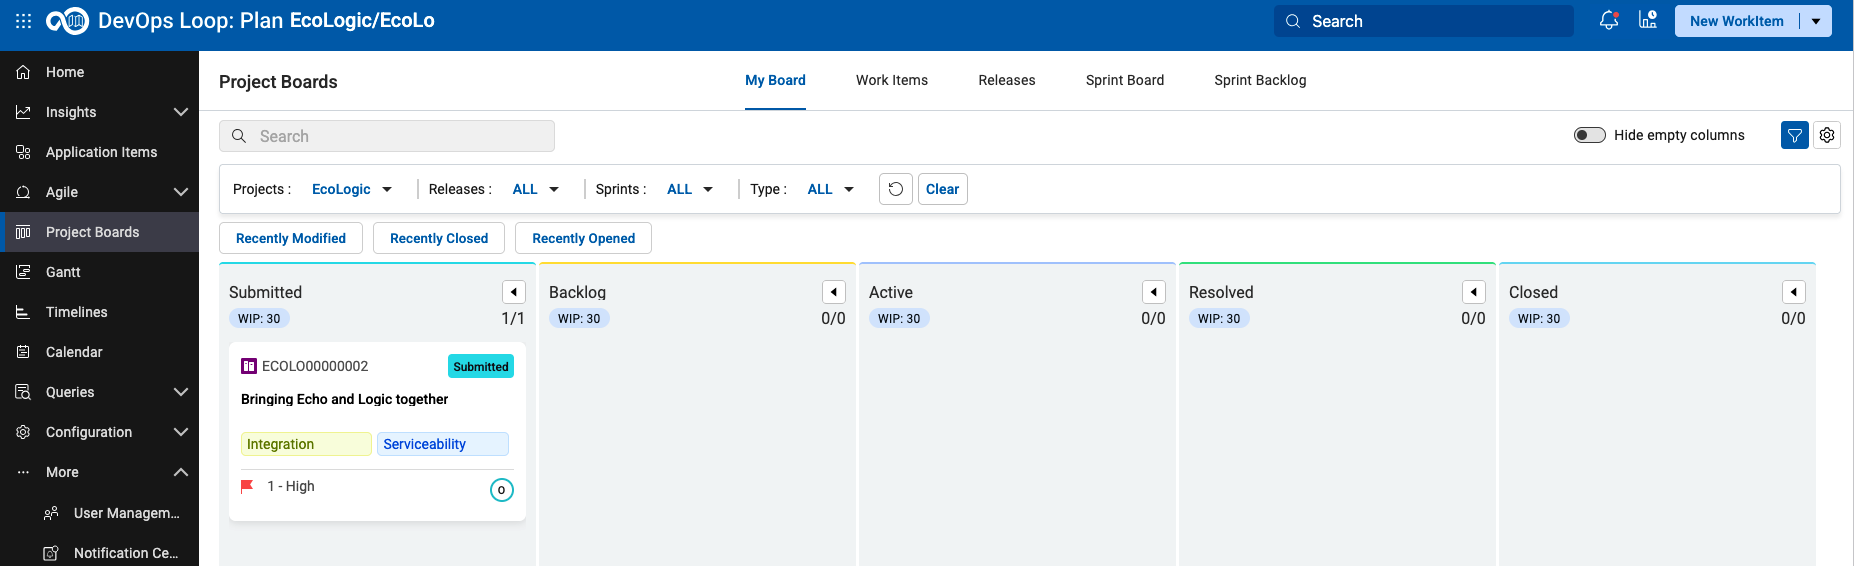
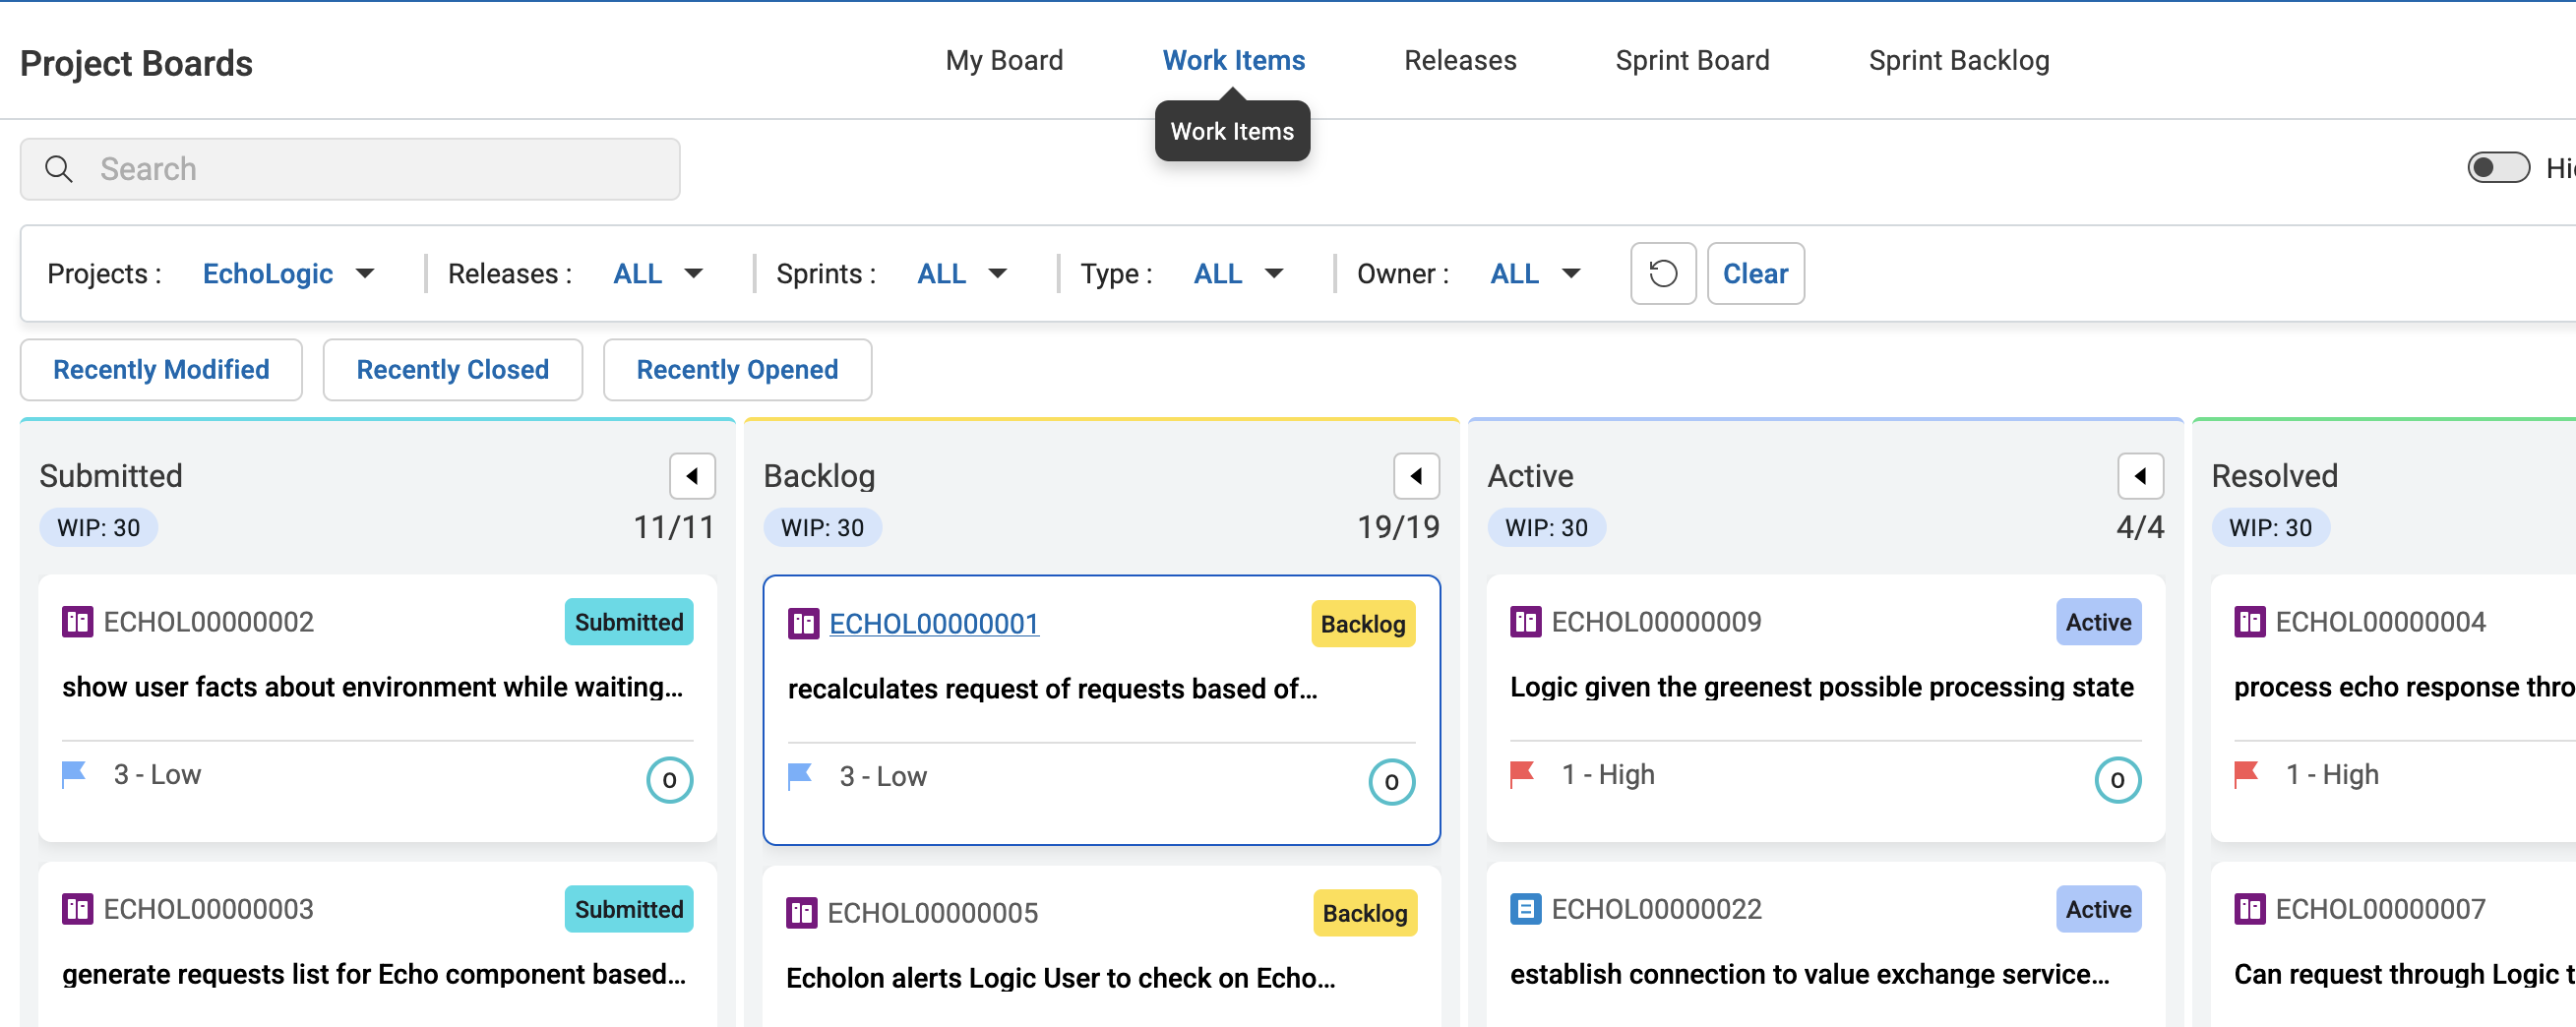
Step Details Additional Information To open the board use the Project Board icon The initial view is your My Board view which will show worktitems that are assigned to you.
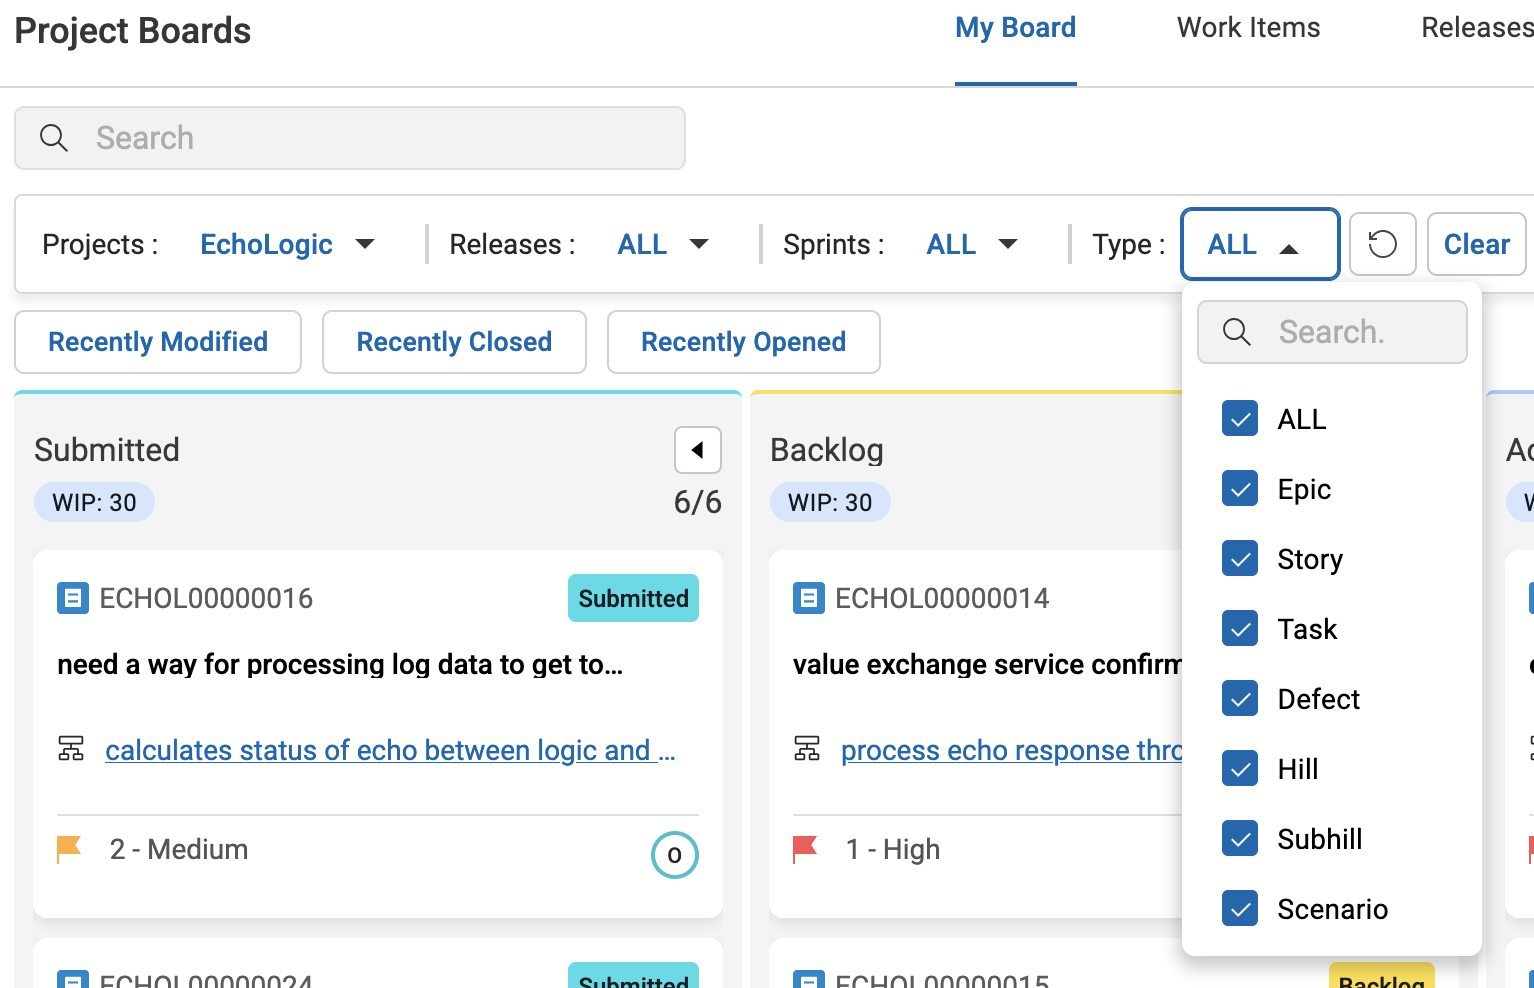
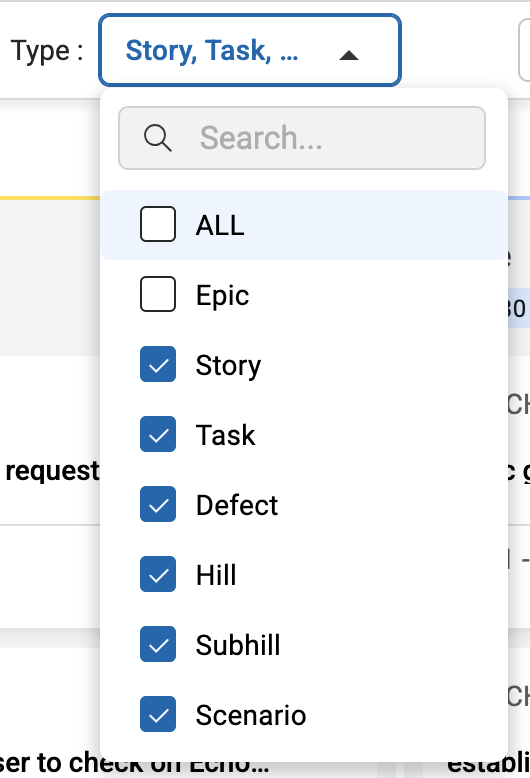
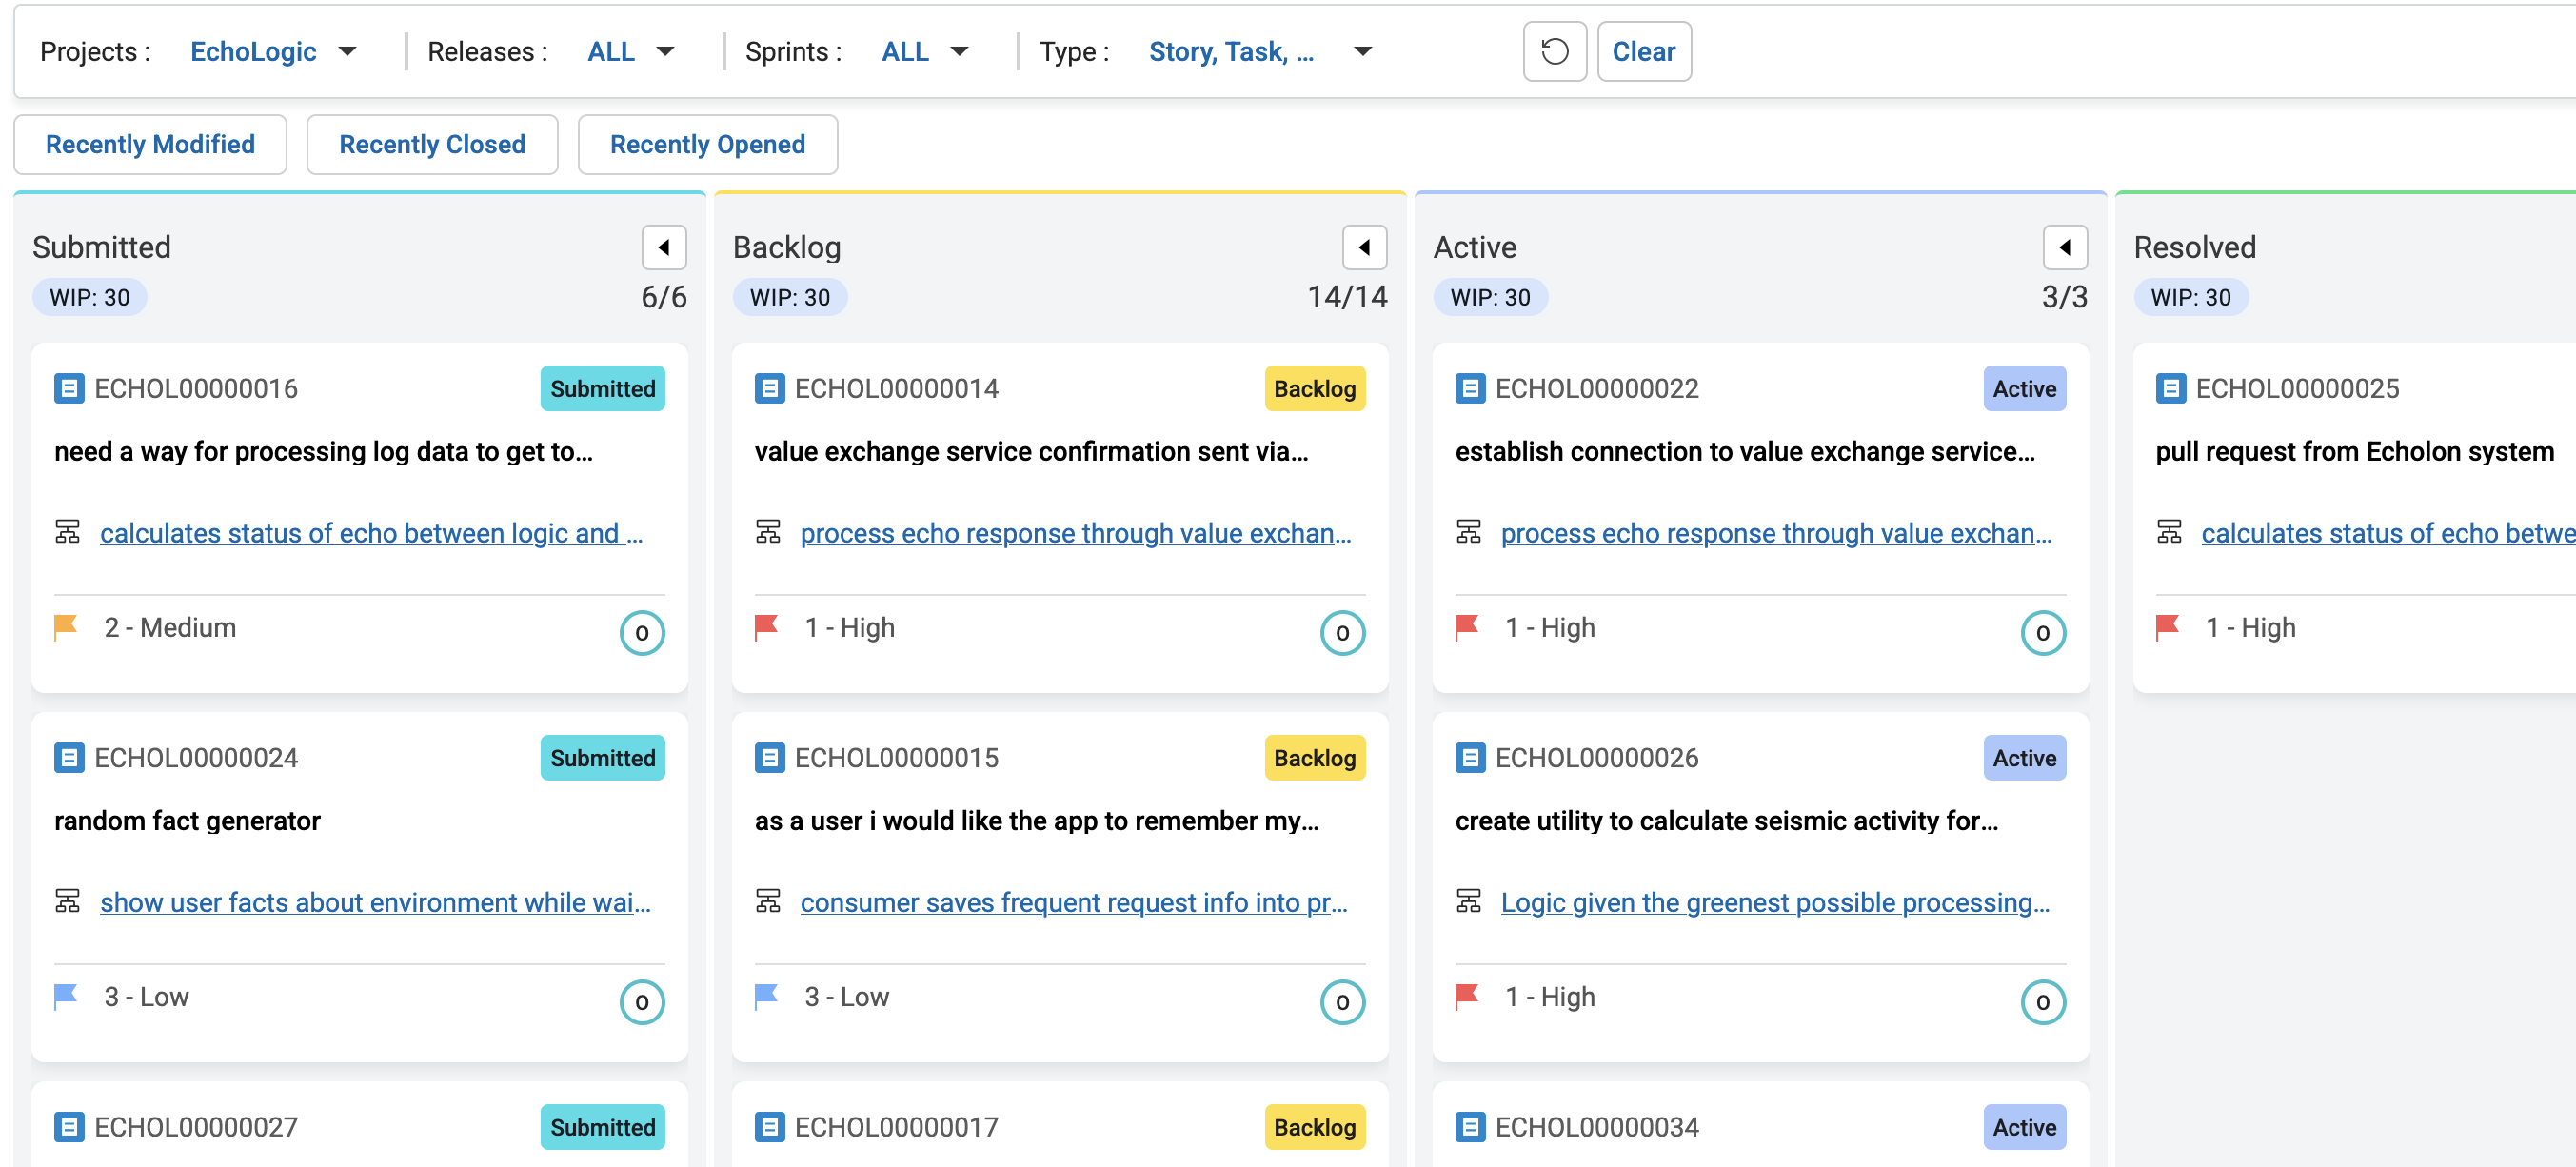
Step Details Additional Information 1 Show how to filter out Epics by using the Type filter 2 Uncheck Epic from the list of Types 3 Click on an empty field to trigger filter 4 Filtered Board (Epics are hidden) is shown 5 Clear the filter by pressing Clear Button
For More about AI Assistant follow this link
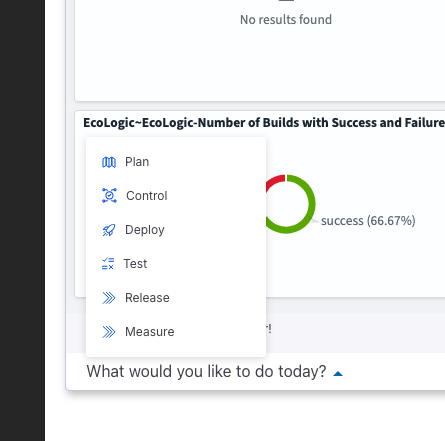
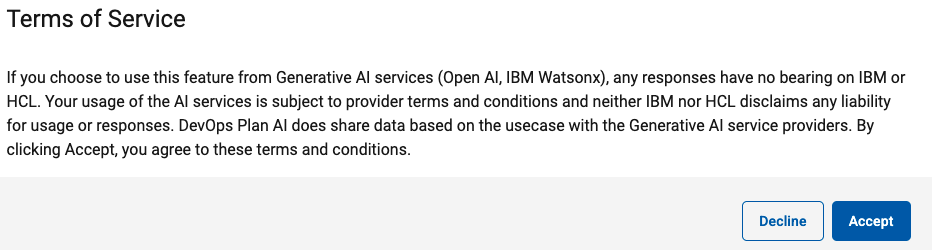
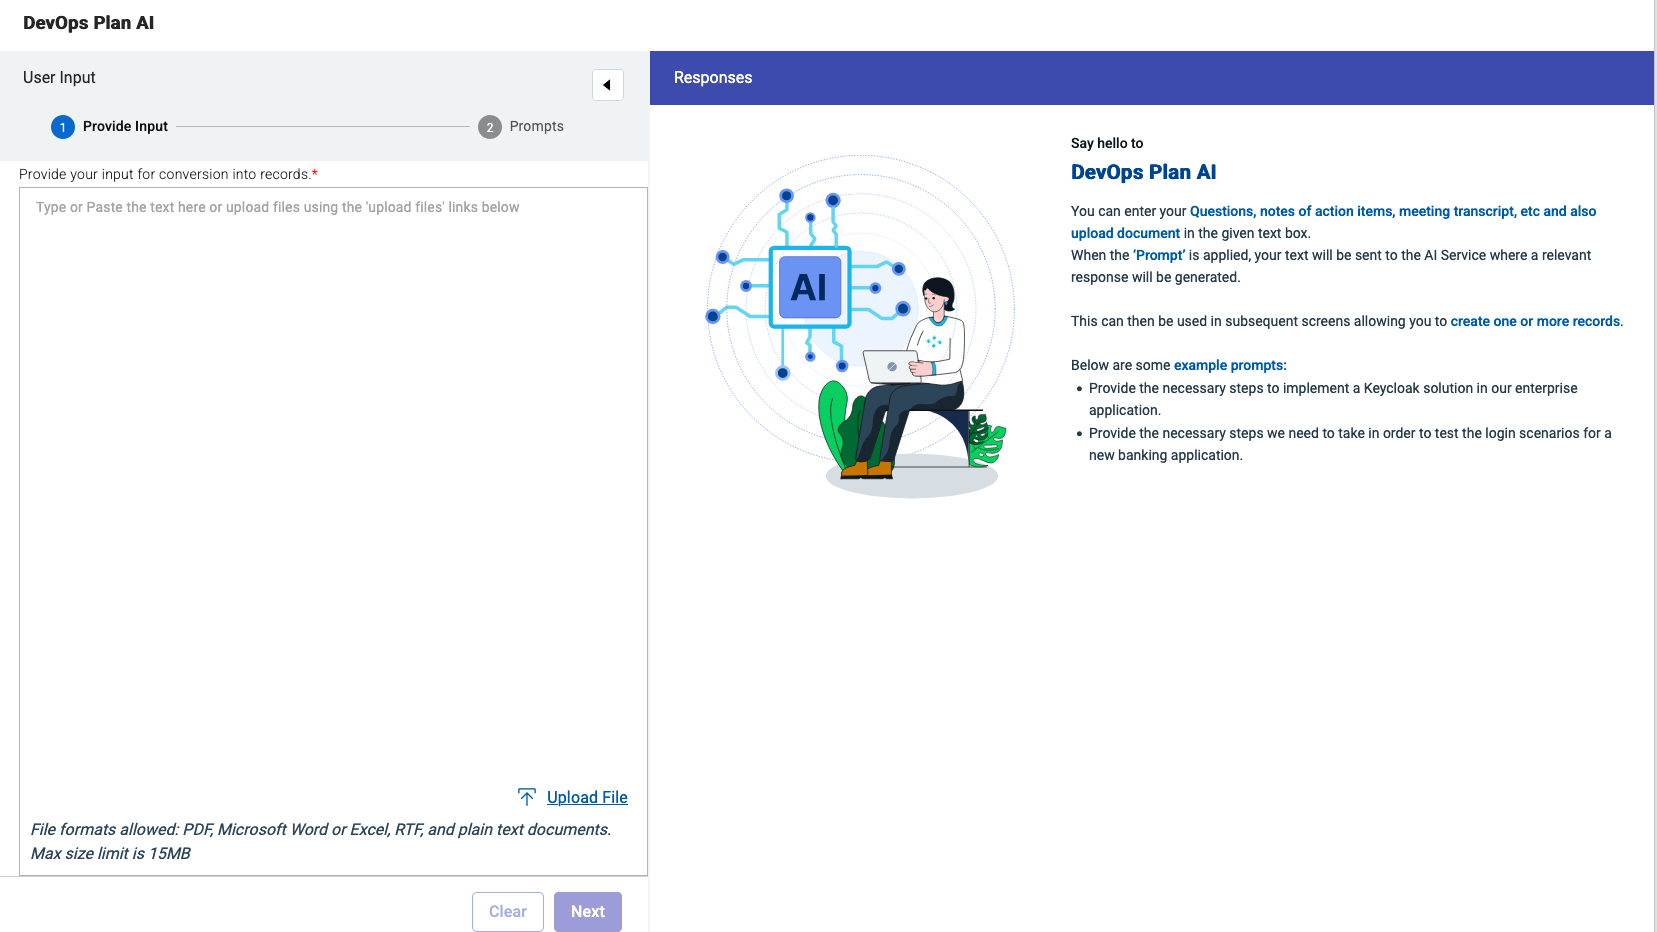
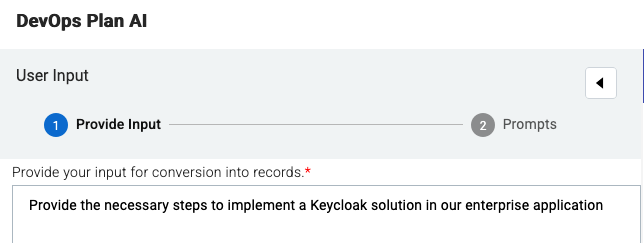
AI Assistant Chat Dialog Step Details Additional Information 1 Select the AI Assistant Icon 2 Accept the terms of service ! 3 The AI Assistant Chat Dialog opens 4 Enter Now a prompt, you can use the example prompts, or enter your prompt 5 Click on the Next Button
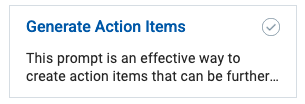
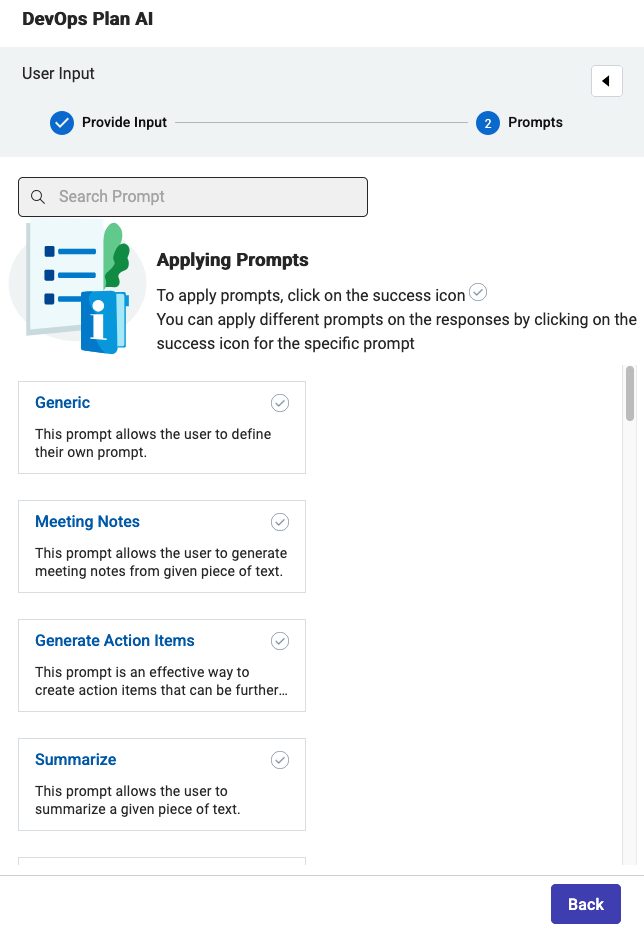
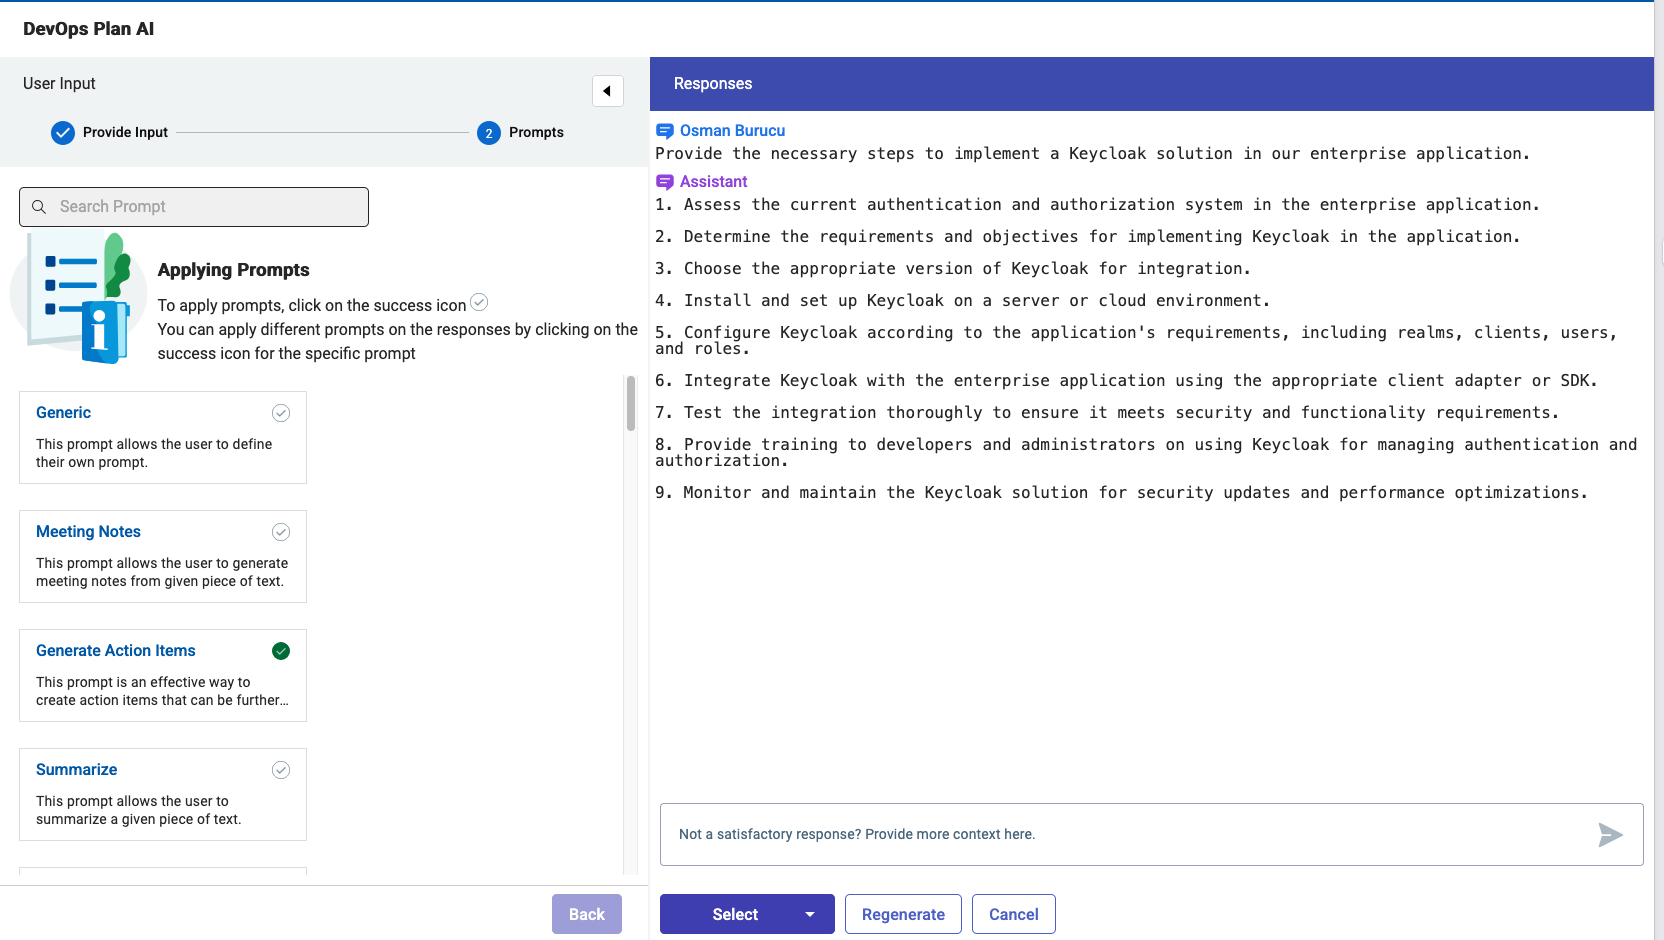
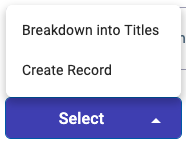
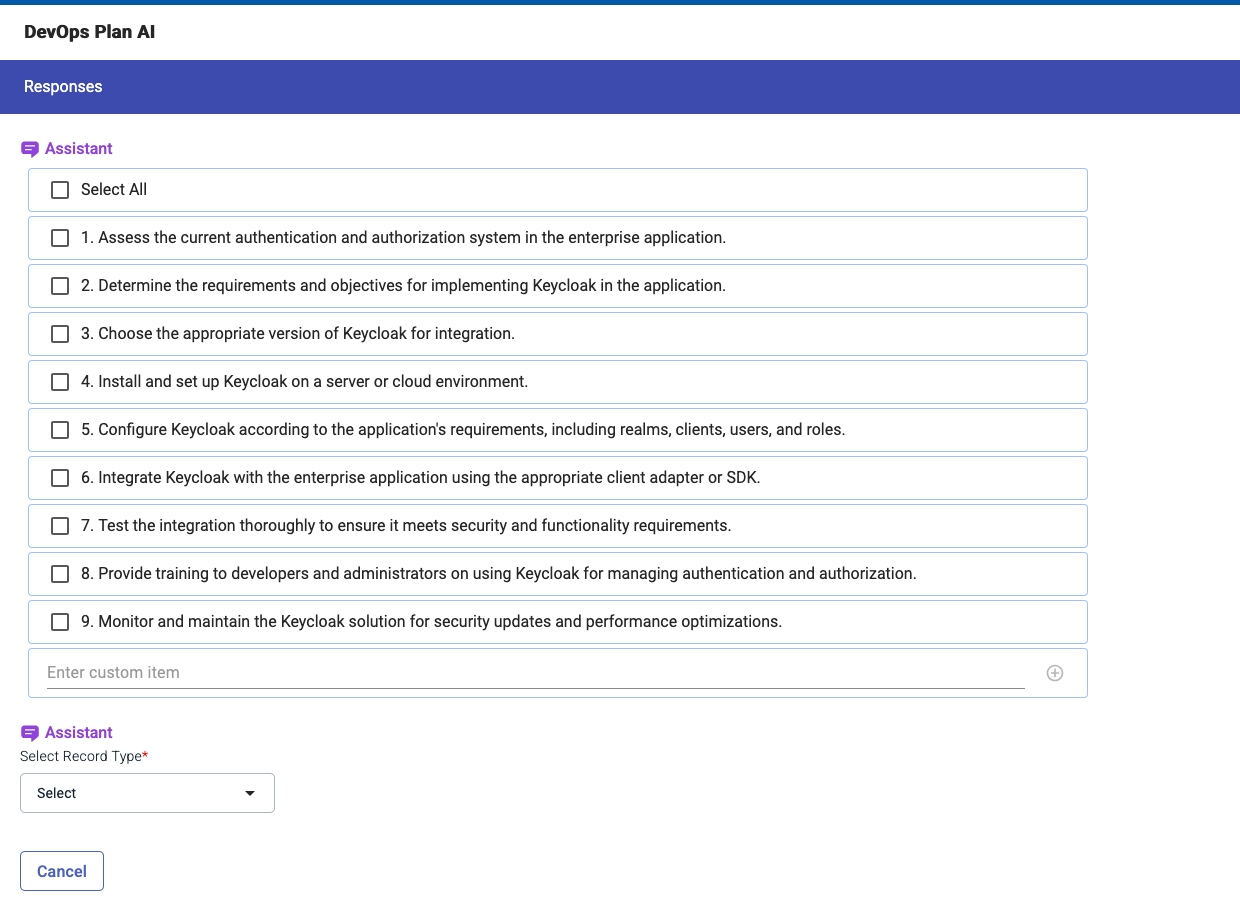
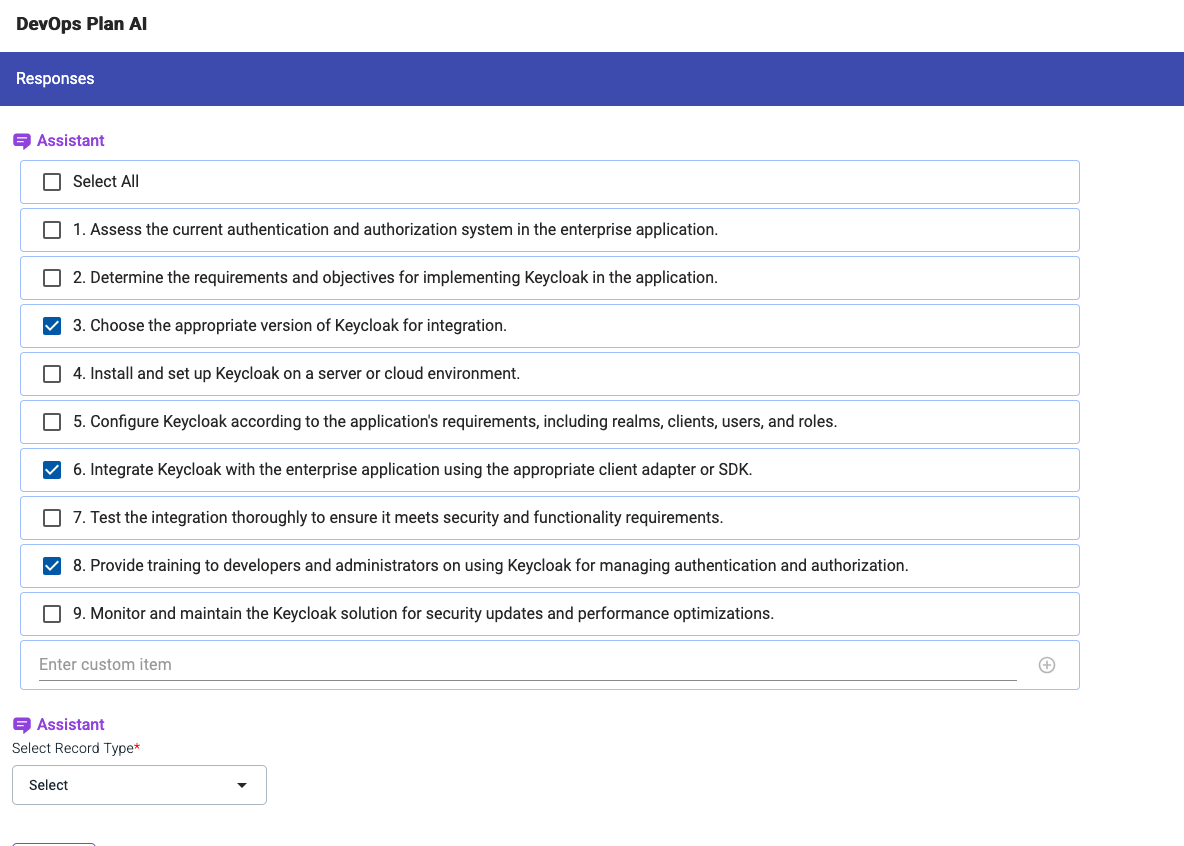
AI Assistant Type of Output Step Details Additional Information 1 Now select the type of Output: 2 We will select Generate Action Items 3 This will generate a set of responses 4 Click the Select Button Break Down into Titles 5 This will convert the list of responses to a list with checkboxes: 6 Select a few you like from the list
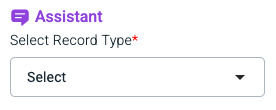
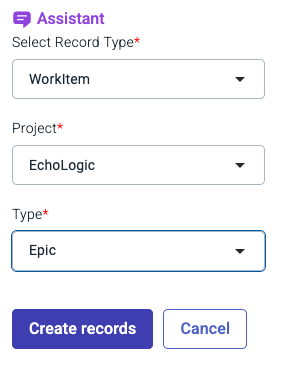
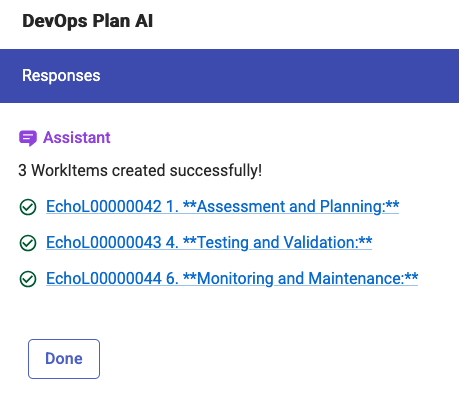
AI Assistant Create Records from Responses Step Details Additional Information Click the Select Record Type Button to select Workitem from the list In the next Dialog select the right Project and Workitem Type for example Project: Echologic and Type: Epic Press the Create Records Button to get the Epics created A few seconds later all newly created records are now created Press Done to finish using the AI Assistant
Step Details Additional Information You can always switch using the central app switcher on the top left of your screen Or You can switch directly to Control by using the button/link from What would you like to do today section
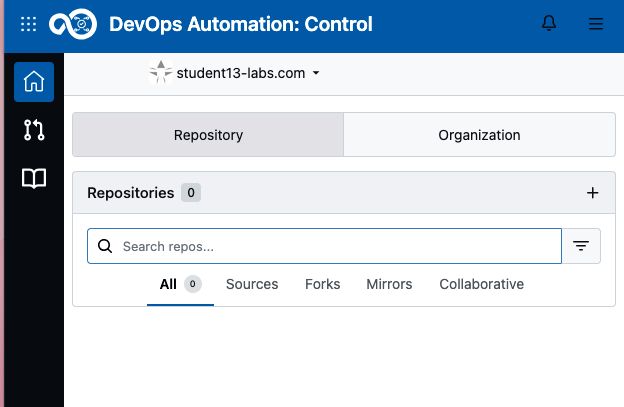
The home page for Control is the Repositories and Organizations view. In this view you will get a list of all your repositories and organizations.
Step Details Additional Information The first time you use Control with no "Learning data " used, an empty list is shown If you have checked the "Learning Data " during Loop creation then the repo will be shown By clicking on the Home Button click on the Pull request Icon Click on the List all Repositories Icon
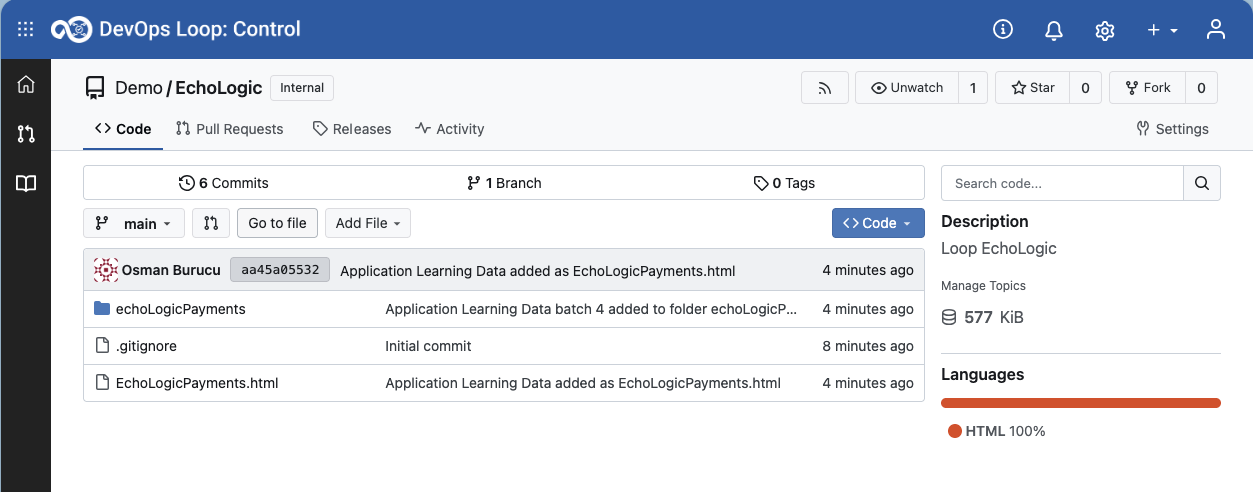
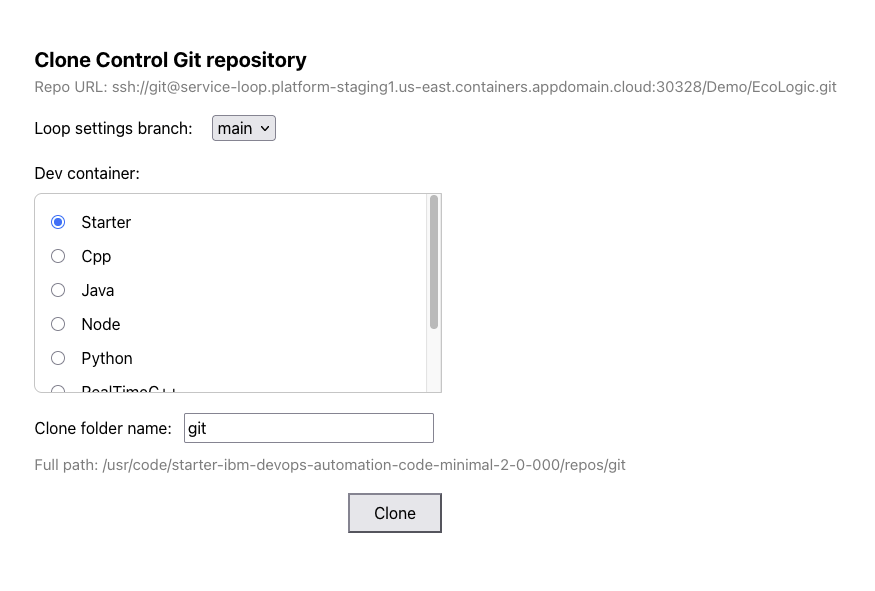
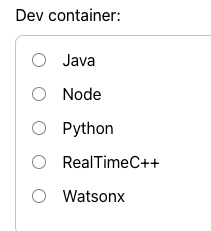
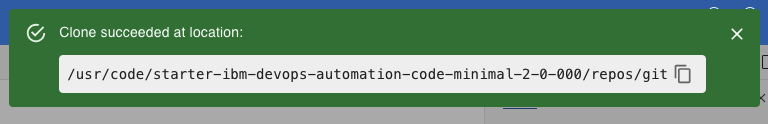
Step Details Additional Information 1 Open the Echologic repository which has been created with the learning data 2 Click on CODE Button 3 Click on Open with Code 4 A new dialog appears to select the right Dev Container for cloning the repository 4.1 Scroll down to see more entries 4.2 use the default values for branch main and target folder git 4.3 If you want to use Watson Code Assistant then select the WatsonX Dev Container, else use Starter 5 Press the Clone Button to proceed 6 it takes a few seconds till your environment is setup and running, please be patient 7 Code and a git clone success message is shown
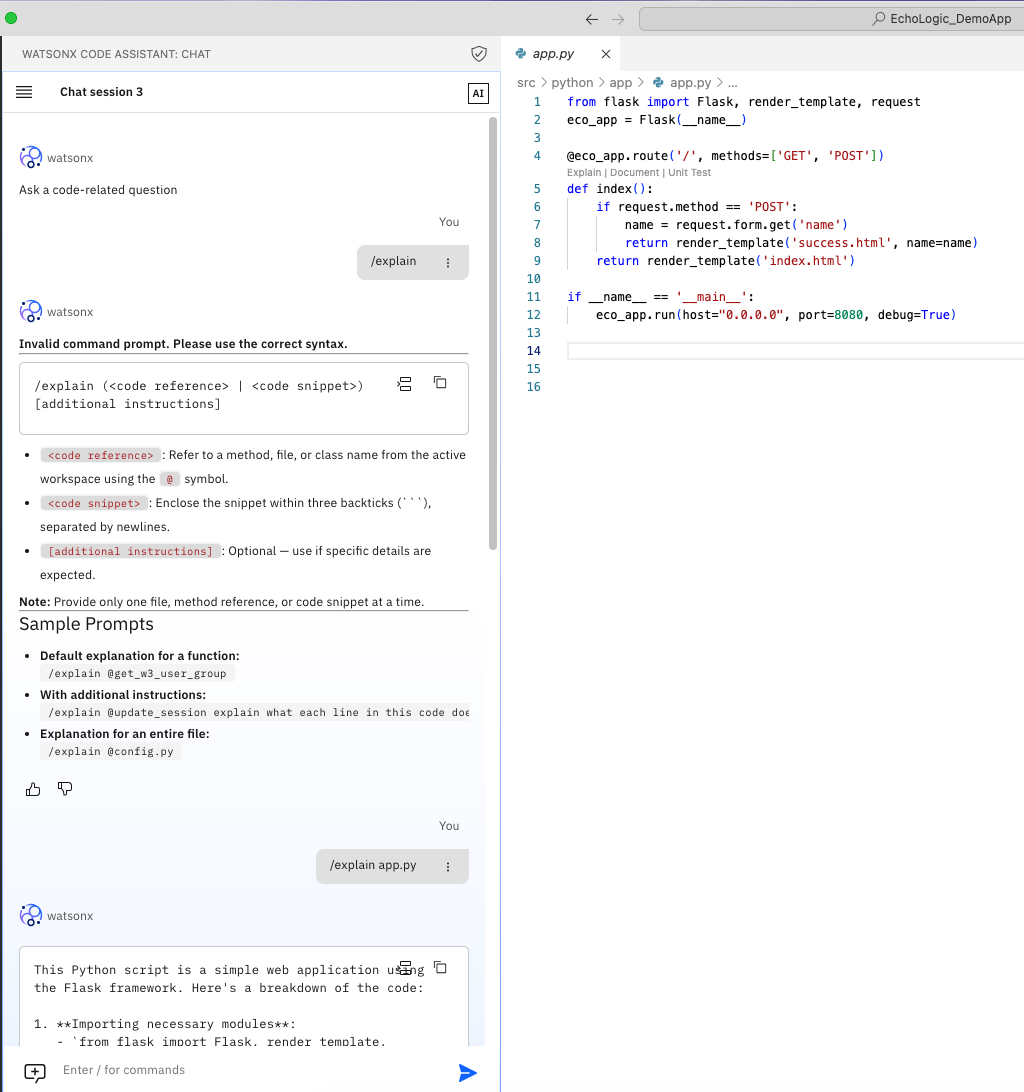
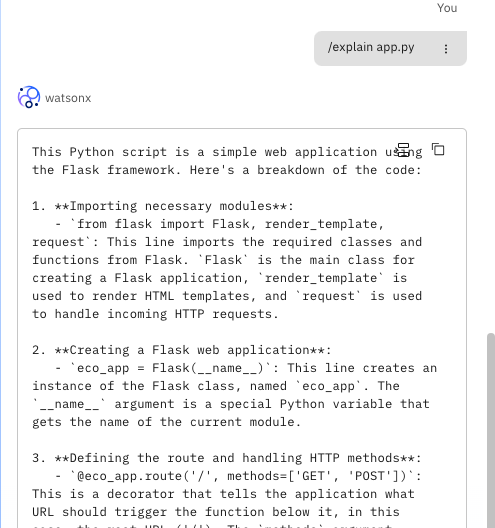
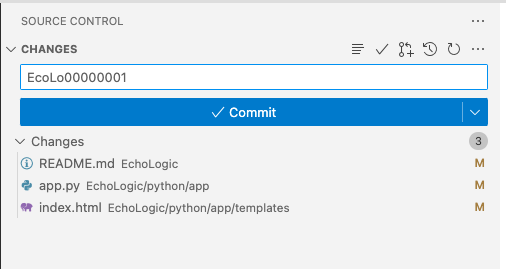
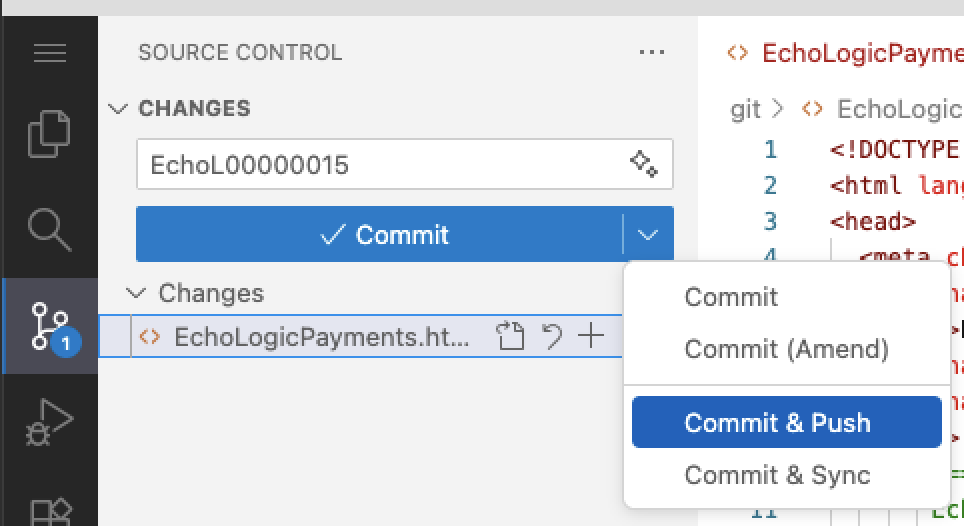
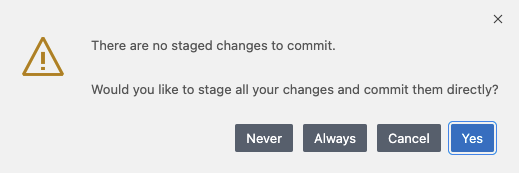
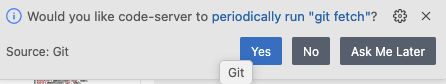
Step Details Additional Information 1 Talk about Code 2 change some code and save the changes to be able to commit to Control 2.1 TODO: add steps with screenshots here! 3 Or optionaly Use WCA to explain code and generate some new code 3.1 here an example 4 Add comment with work item number 5 Click on Commit&Push by opening the Commit Button 5.1 a message might appear about staging changes, press the Always button 5.2 a message might appear about fetching changes from git, press Fetch
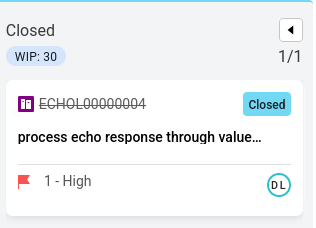
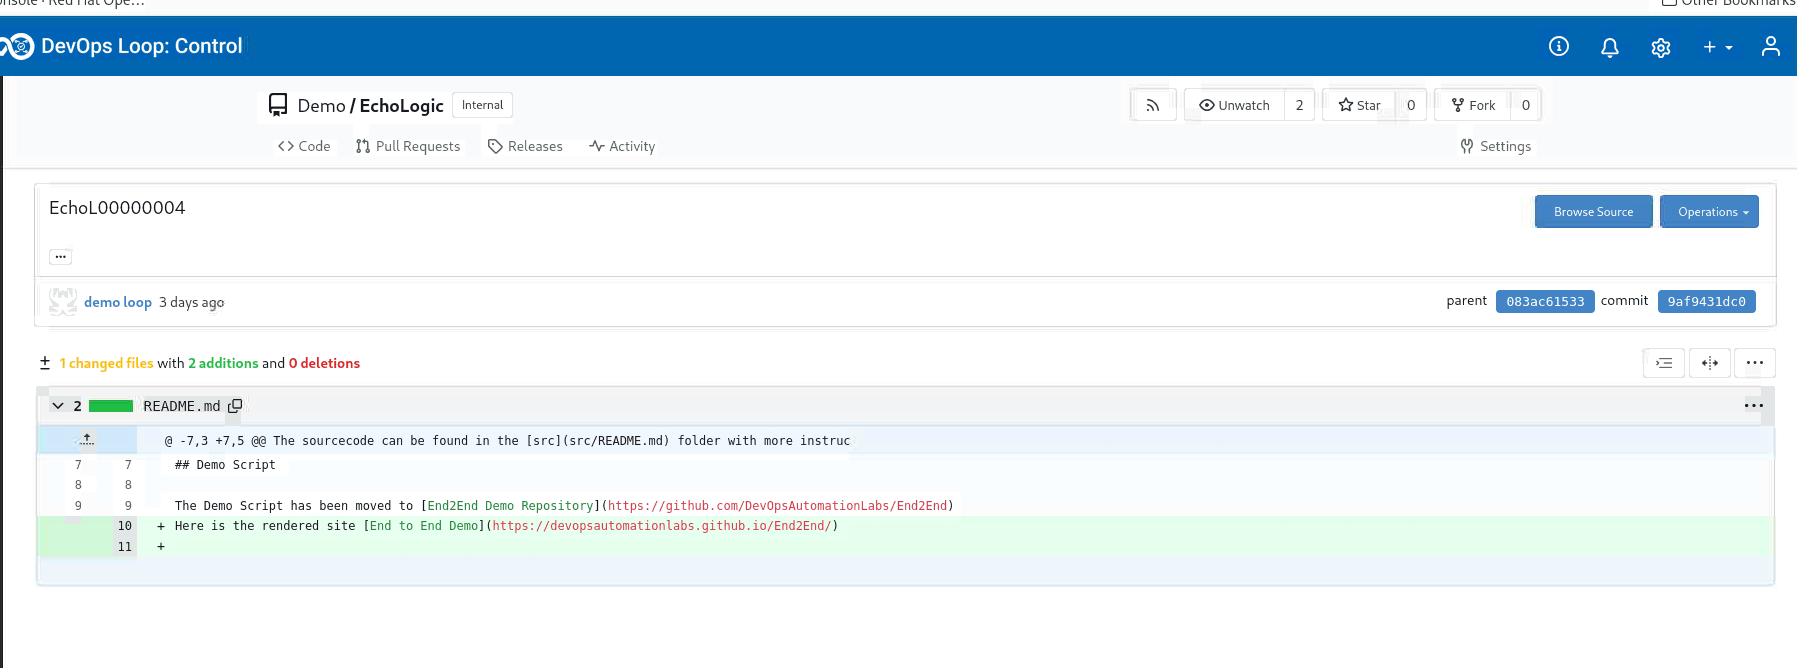
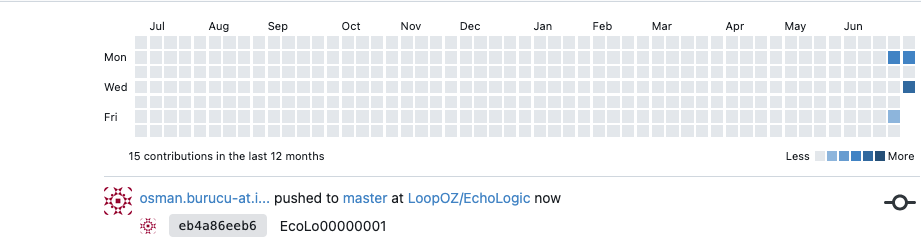
Step Details Additional Information Show the Update in the activity report of the repository
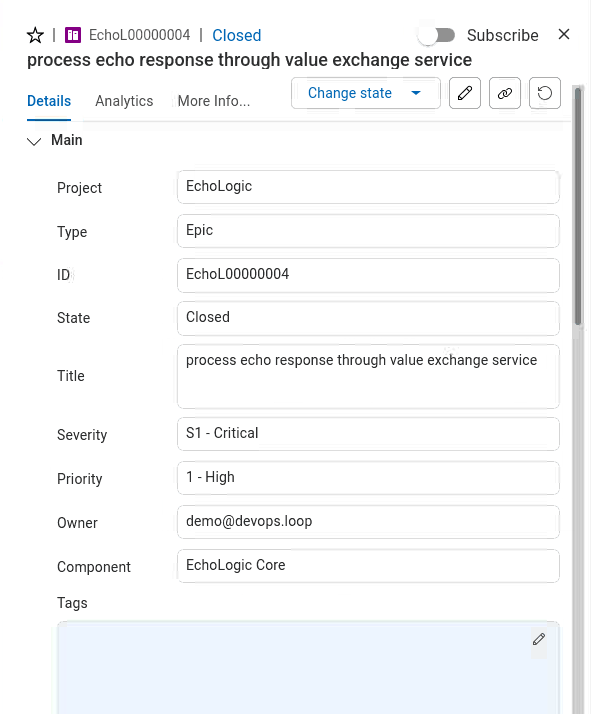
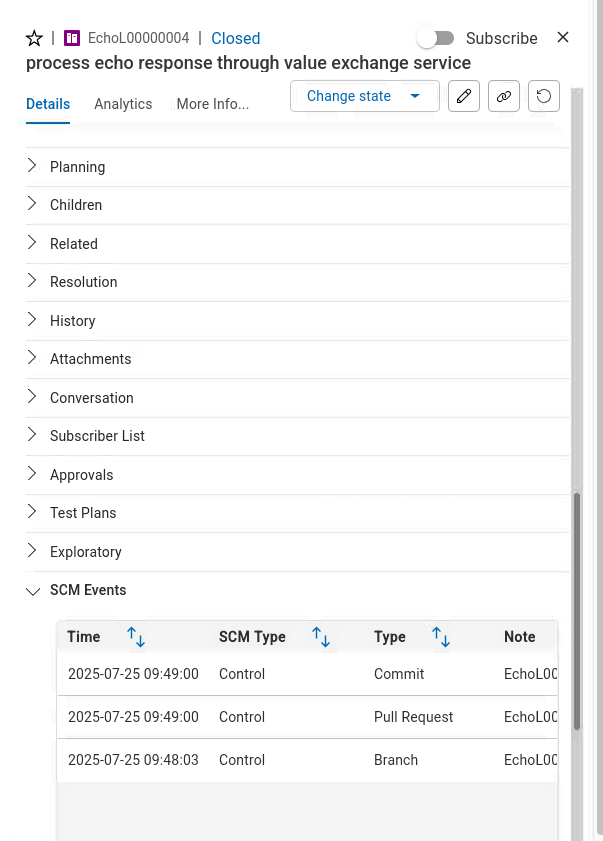
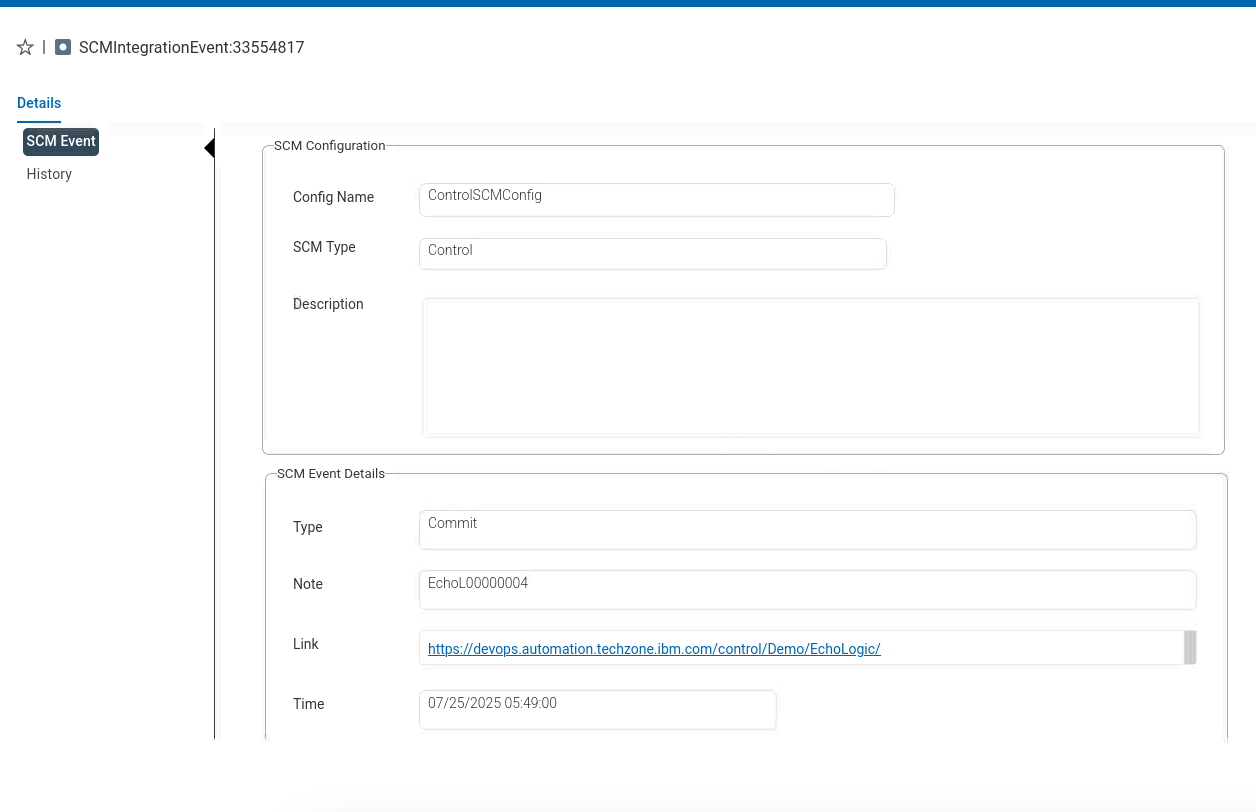
Step Details Additional Information Show the Git Commit Details
Step Details Additional Information You can always switch using the central app switcher on the top left of your screen Or You can switch directly to Build by using the button/link from What would you like to do today section
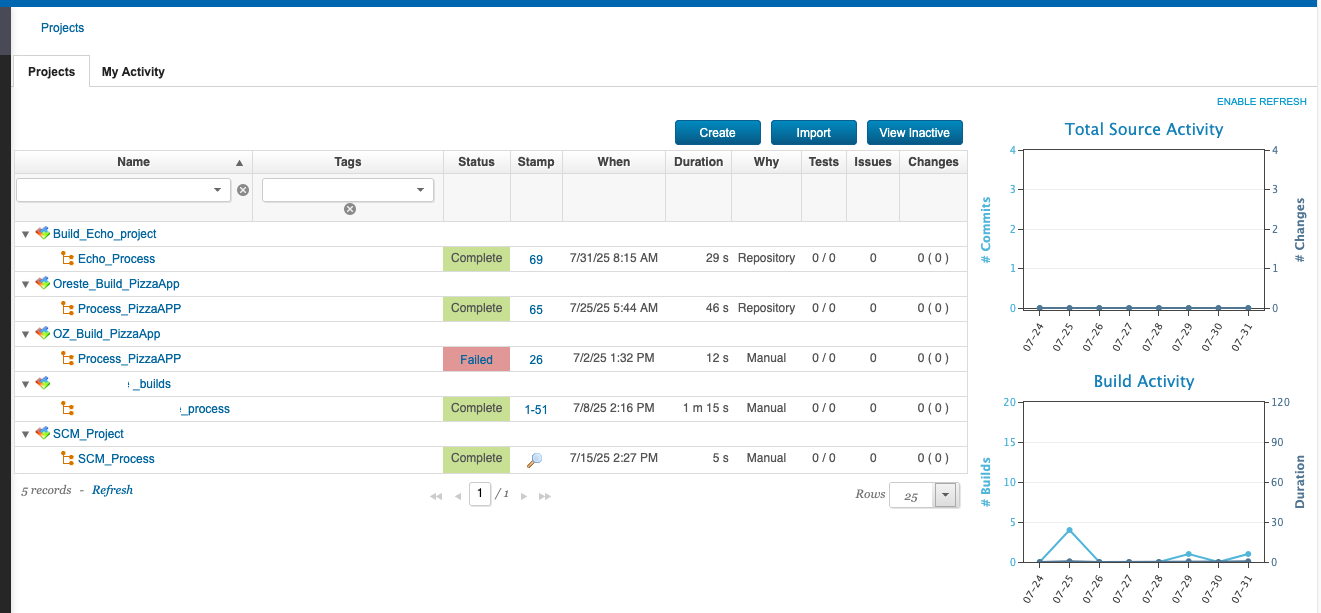
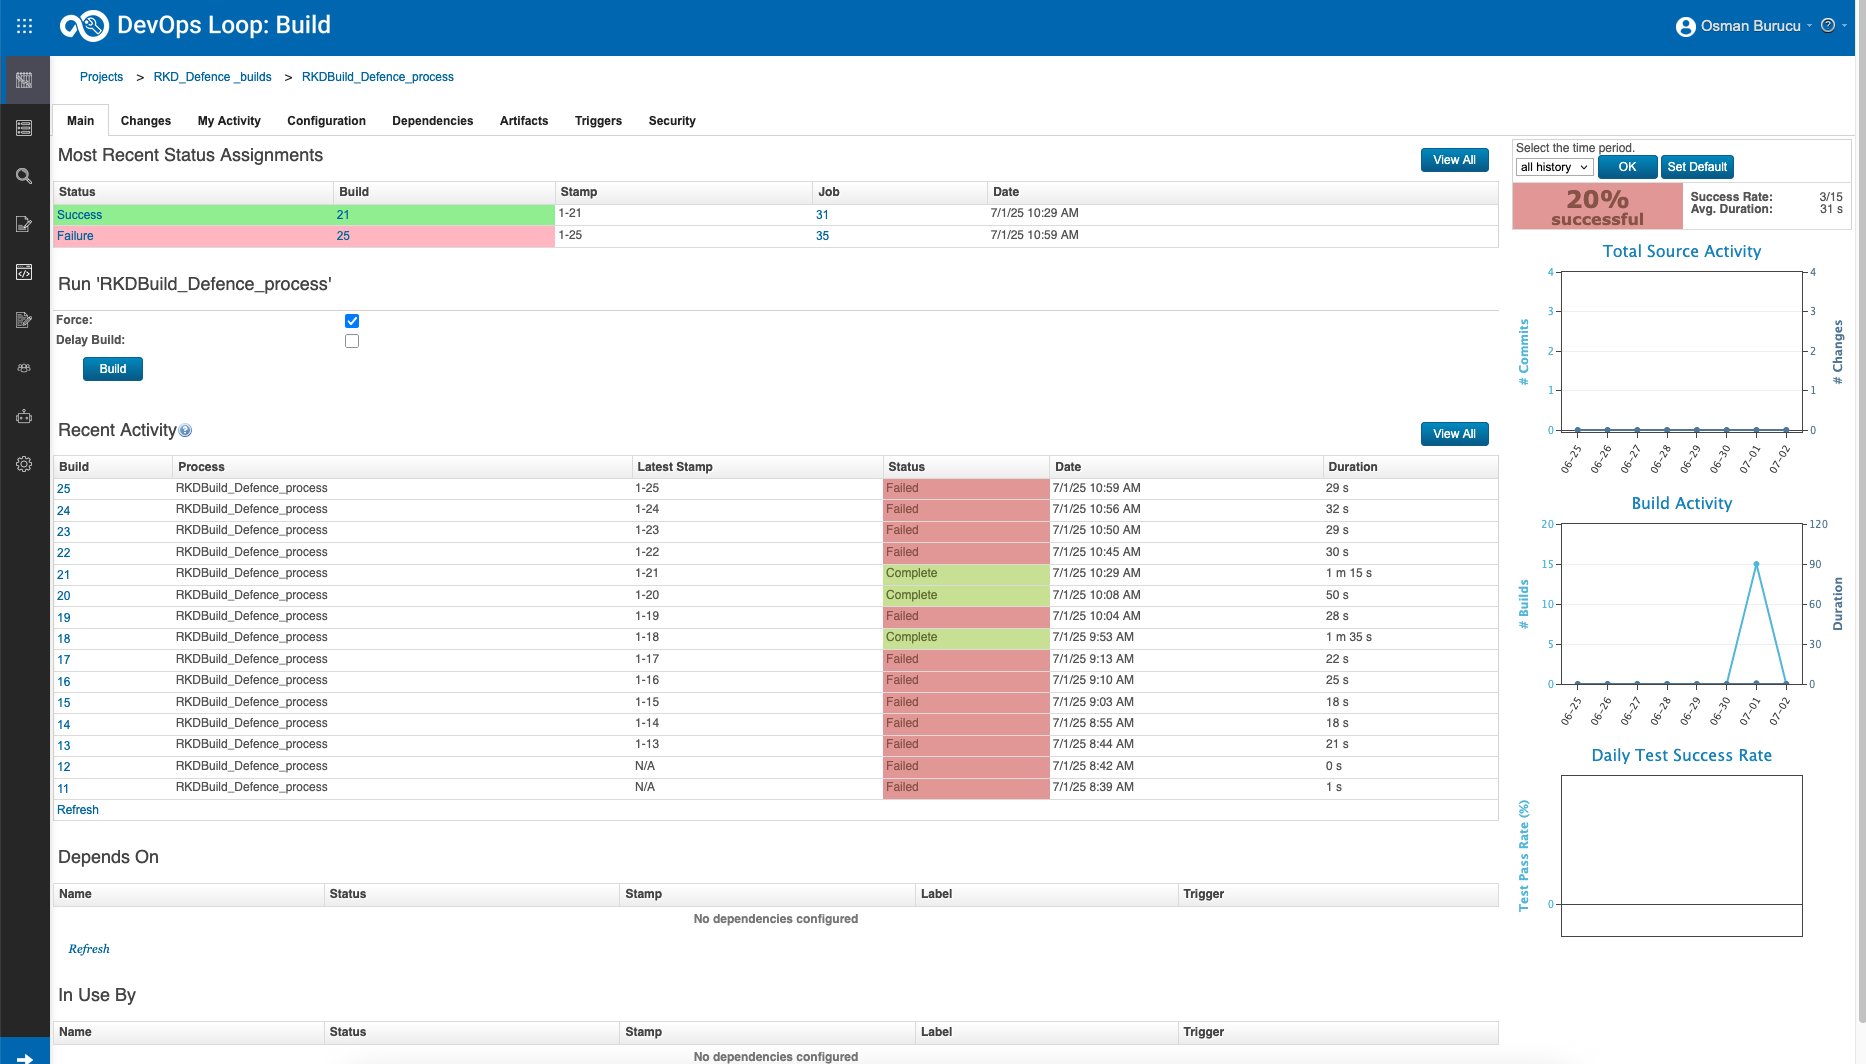
Show Build Runs and Details Step Details Additional Information The initial page shown in Build is the Project build runs page Click on Triangle to show results of most recent builds Additional metrics like Build & Source activities and Unit test results are shown on the right side On top of the list 3 Buttons, Create , Import and View Inactive/Active are shown
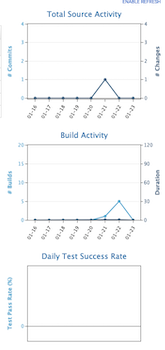
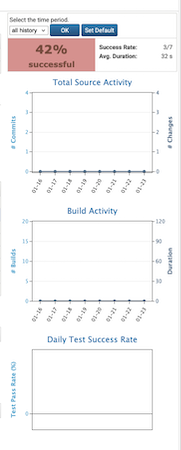
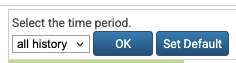
Step Details Additional Information Click on one of the link to view the details of all runs Shows overview on most recent build runs and their results additional information are the success rate of all builds, Build & Source activity and test results The time period can be changed for the metrics using the filter control
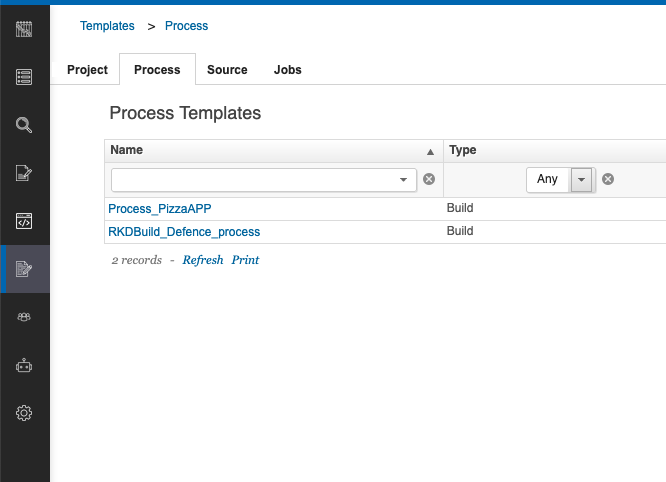
Show Build Templates Step Details Additional Information Show Build Process Templates
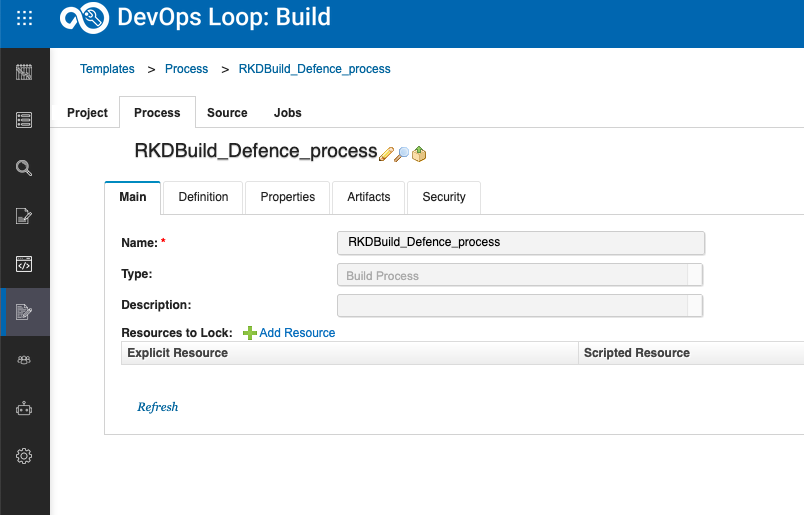
Step Details Additional Information Show Build Process Template Detail
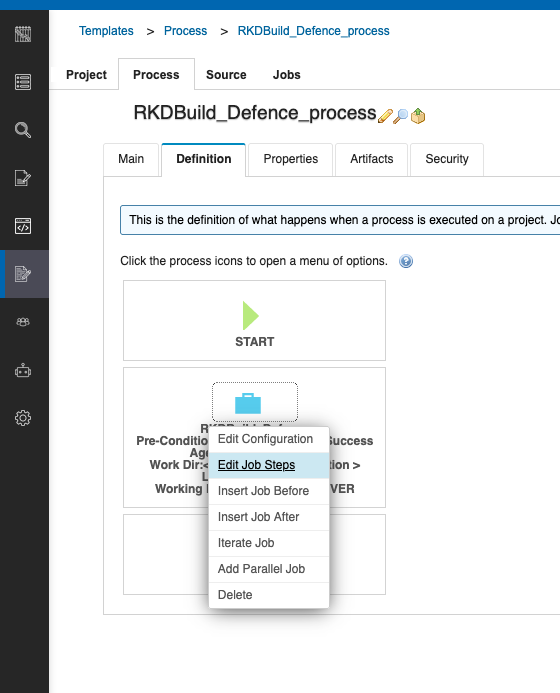
Step Details Additional Information Show Build Process Template Definition
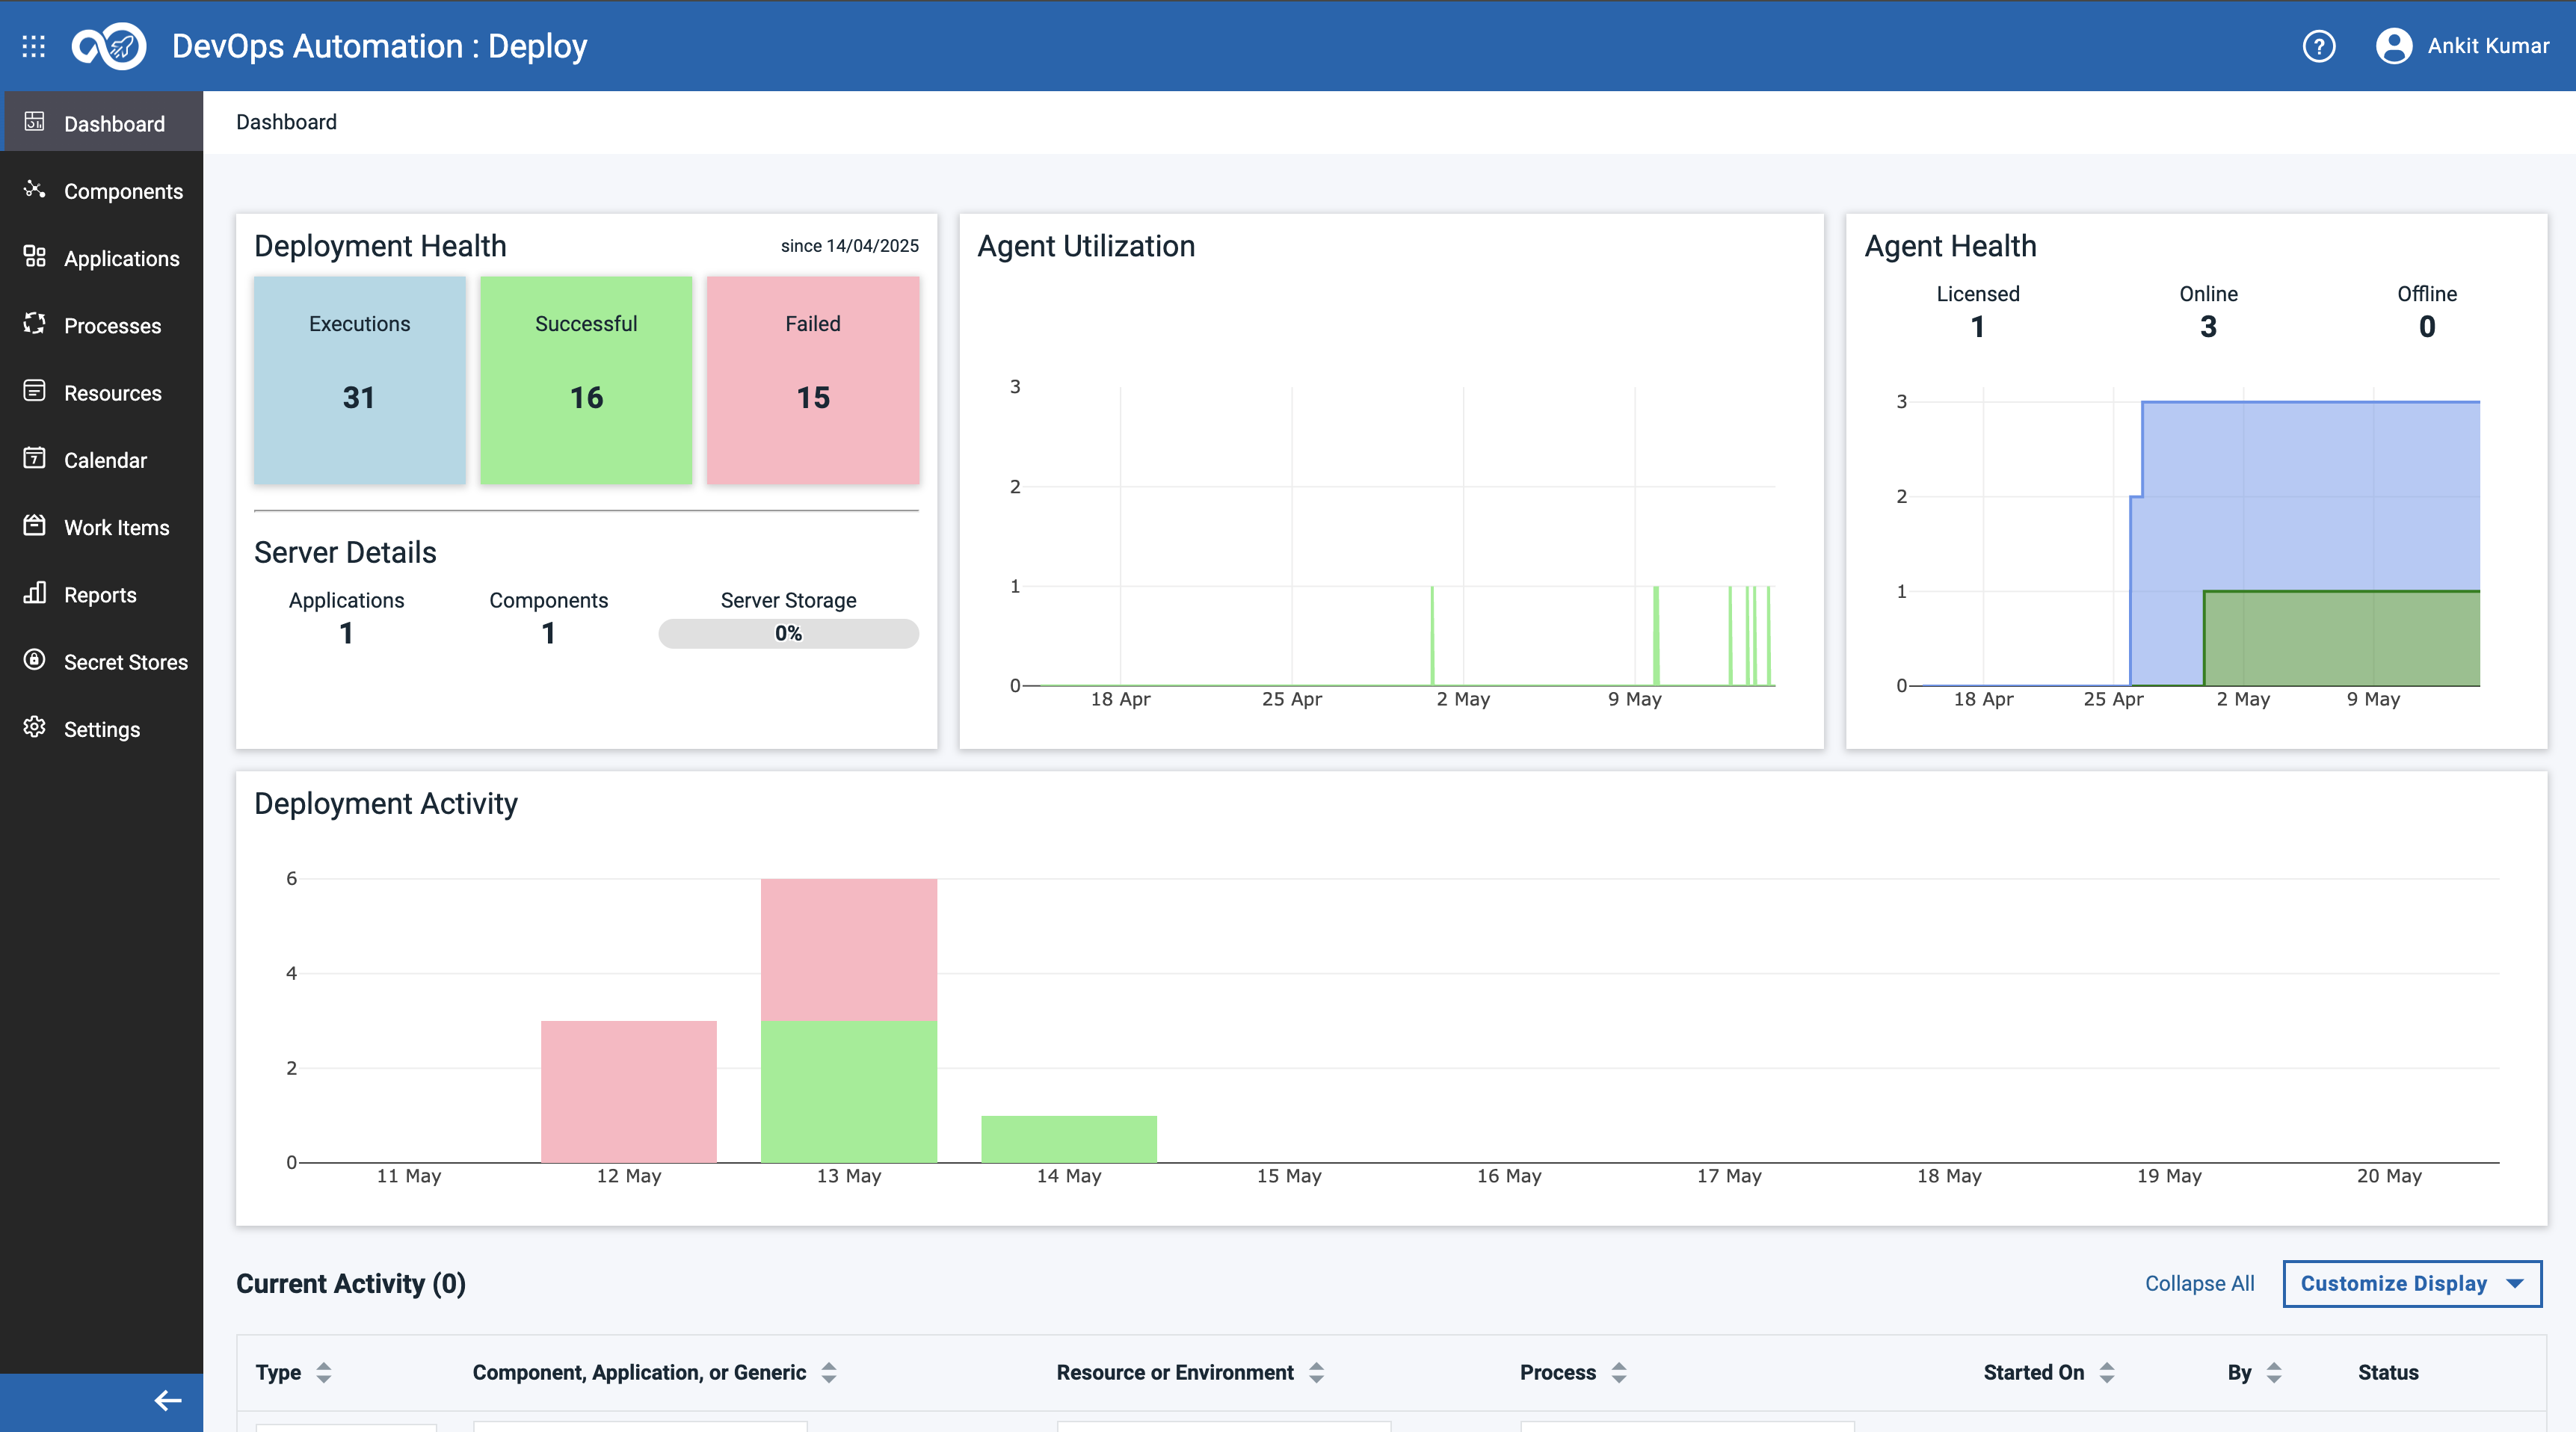
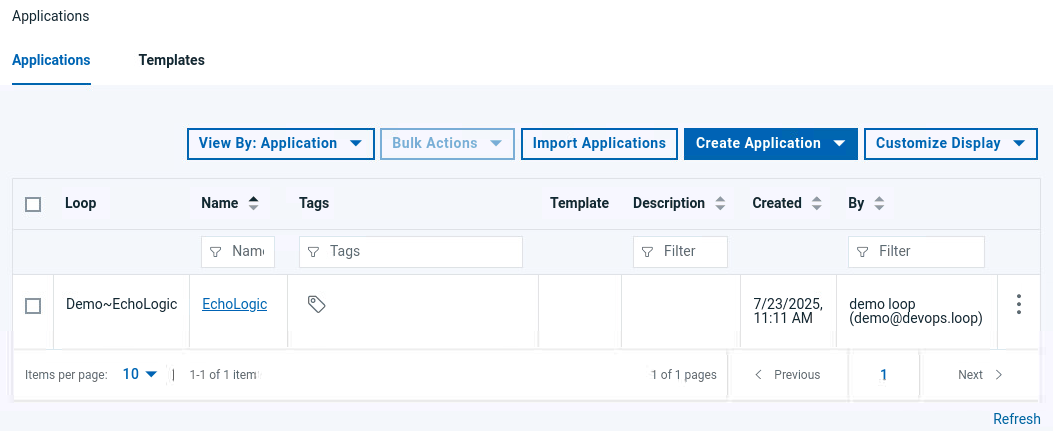
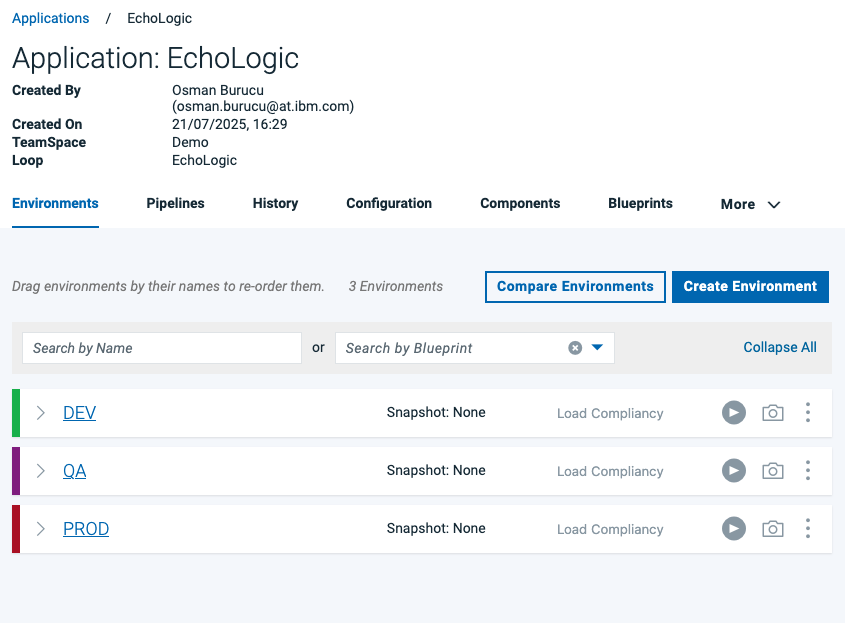
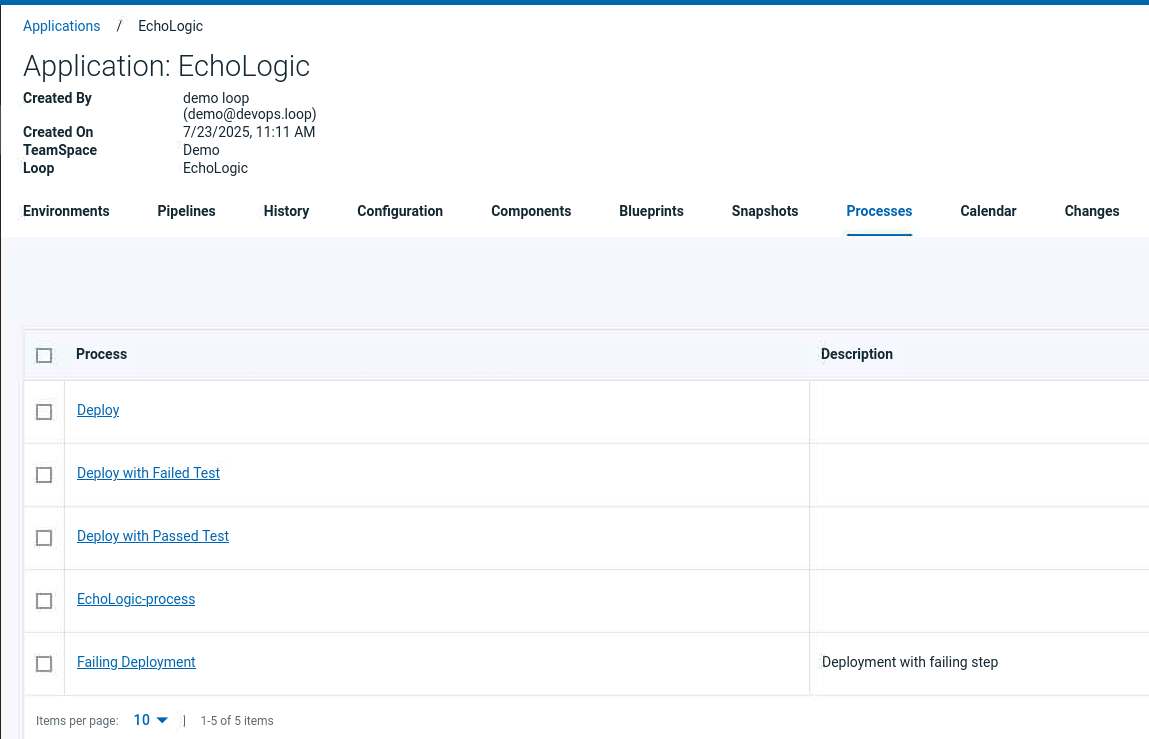
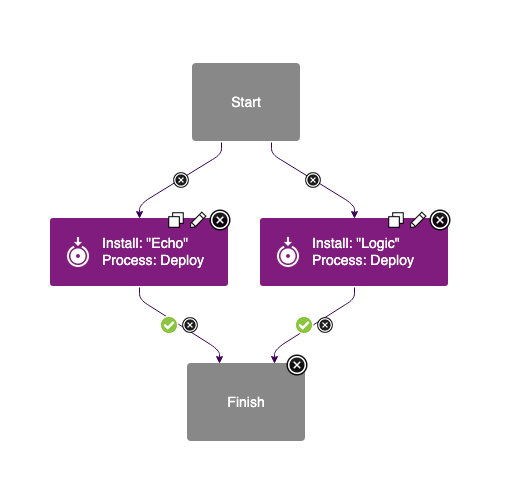
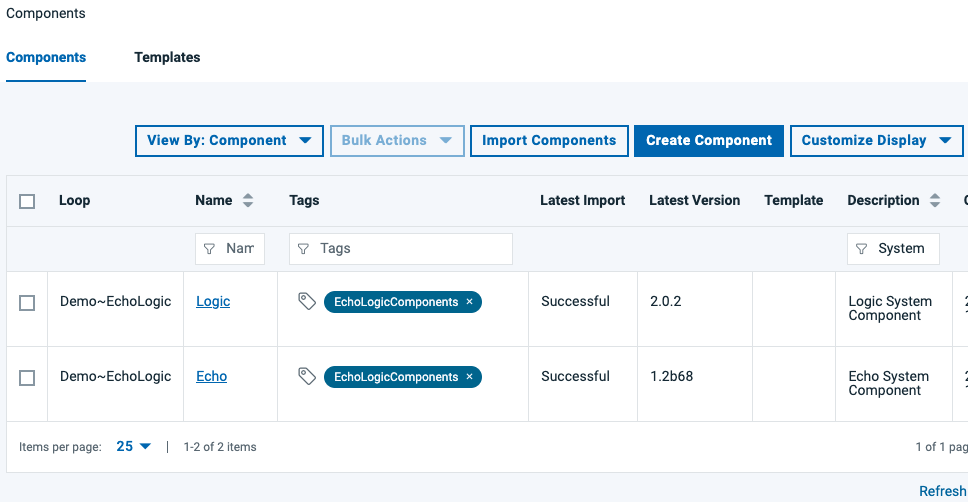
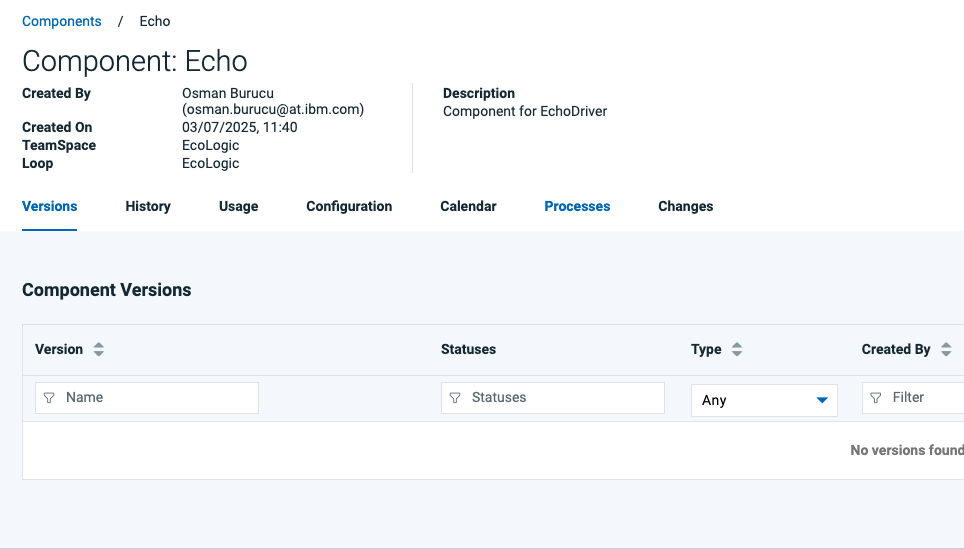
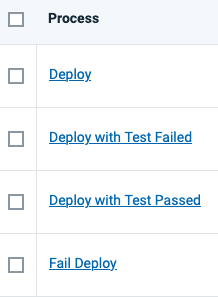
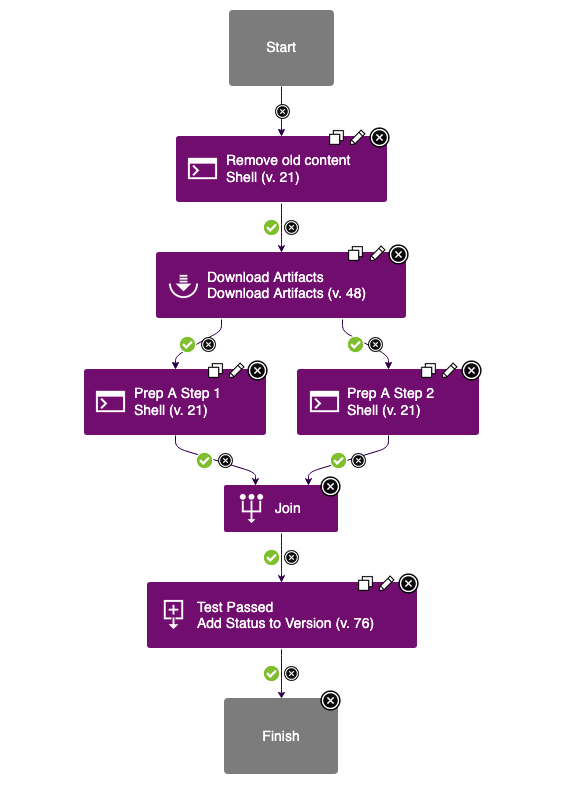
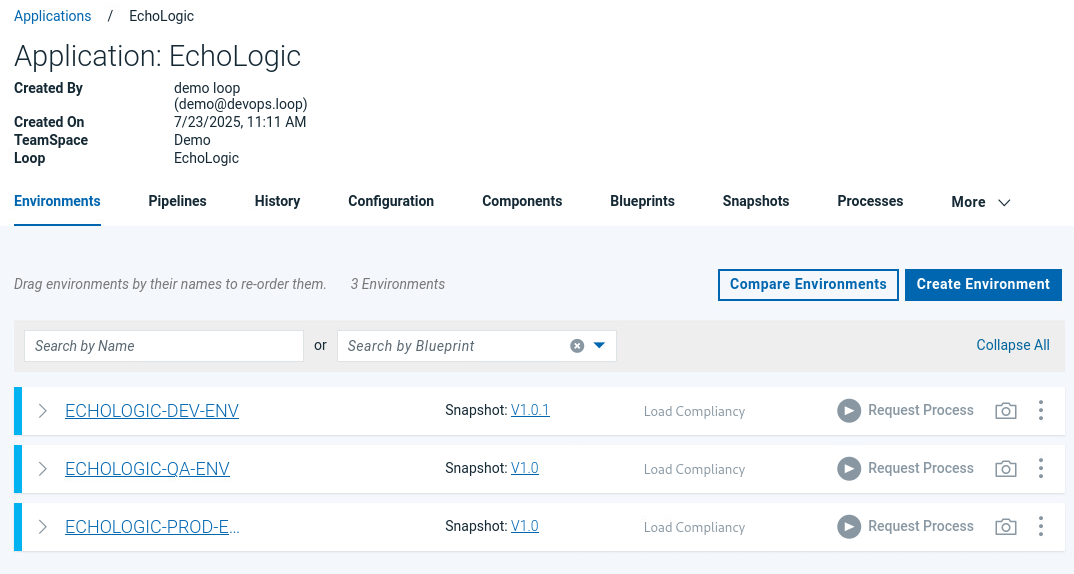
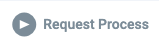
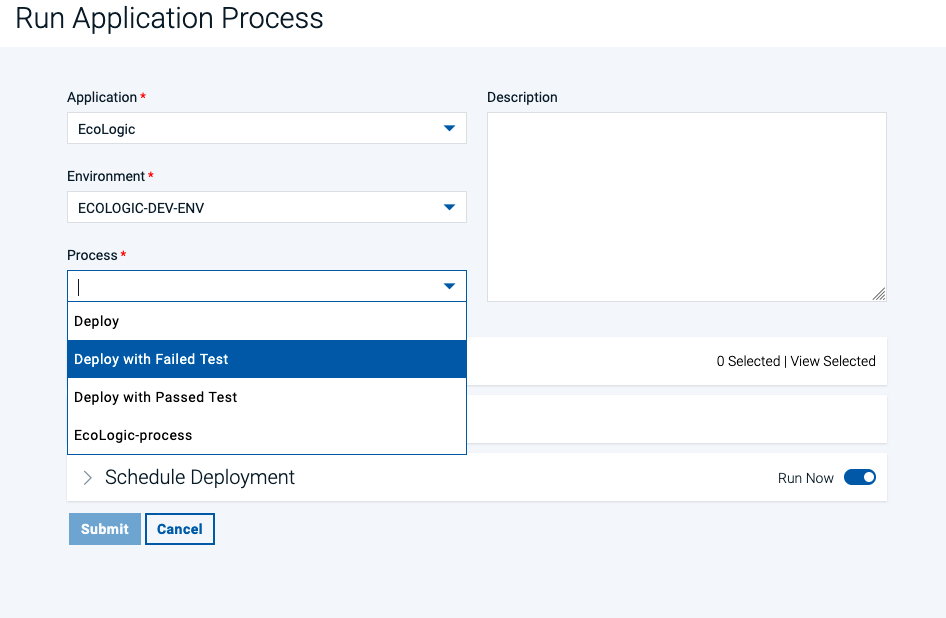
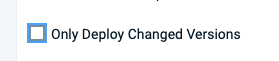
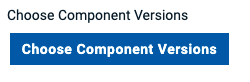
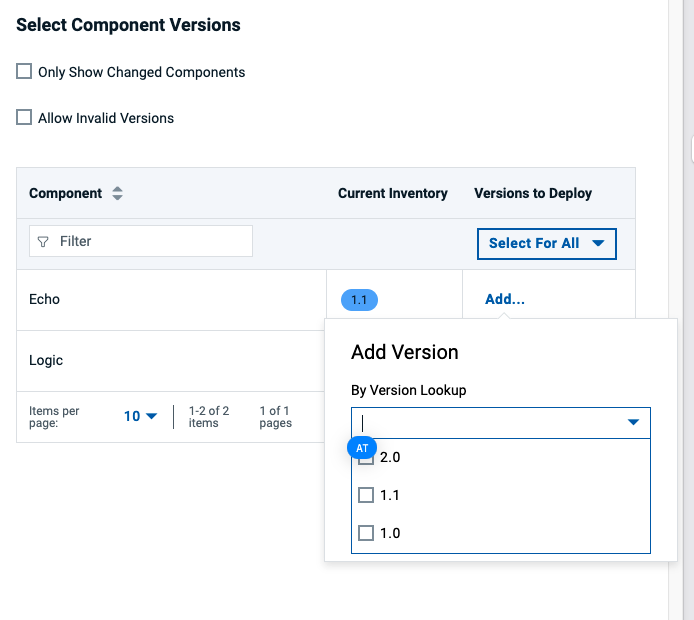
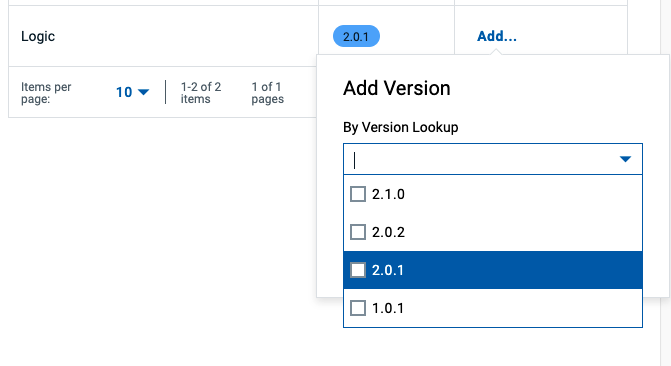
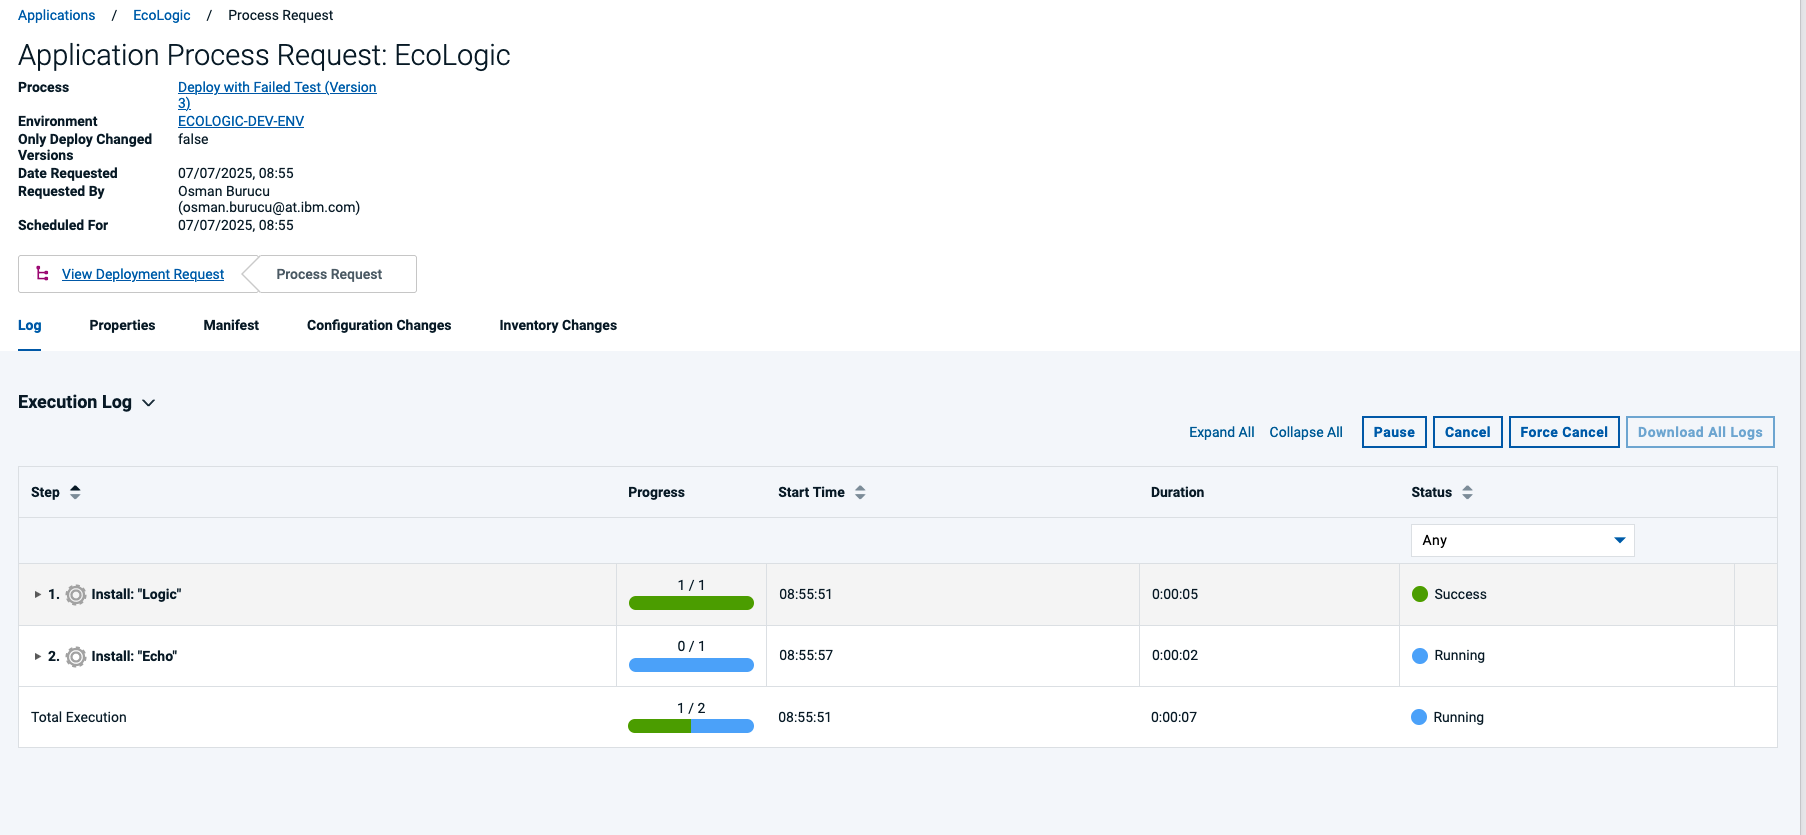
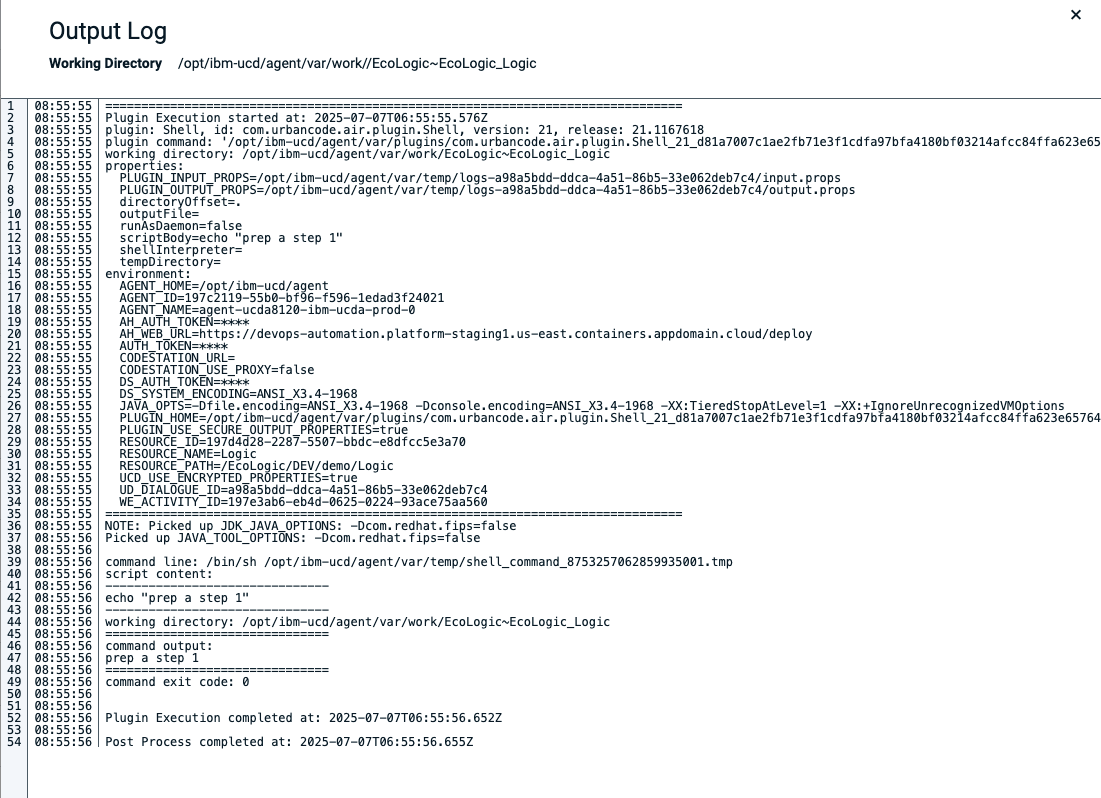
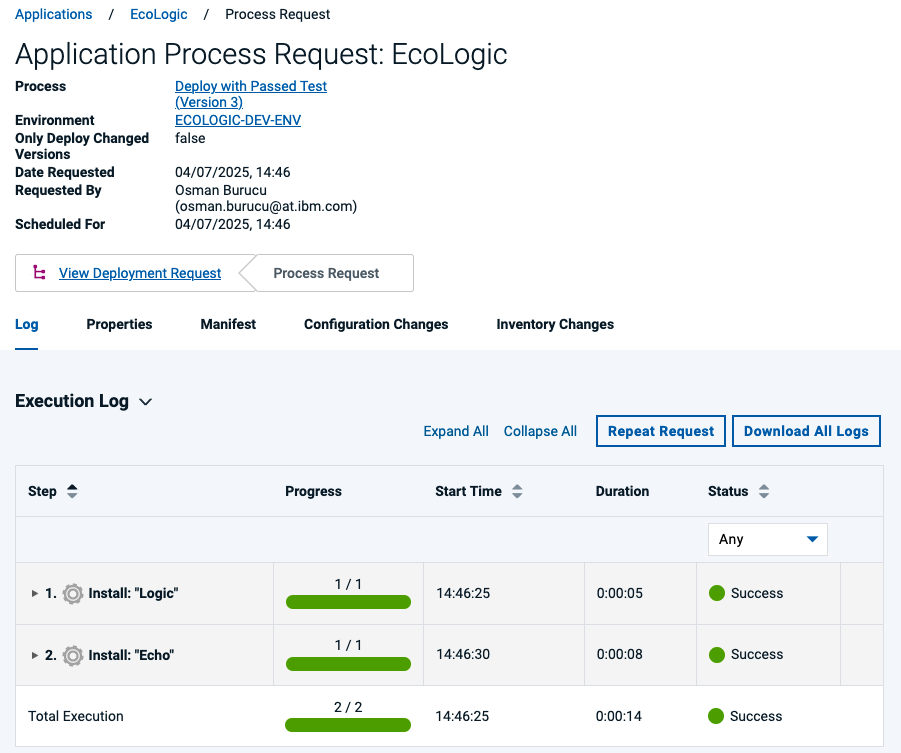
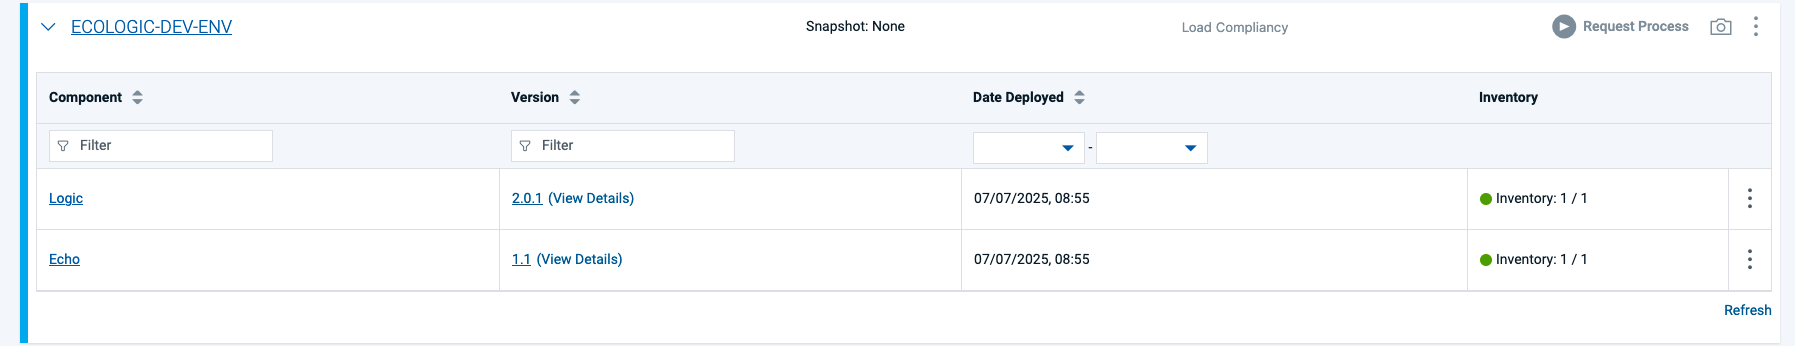
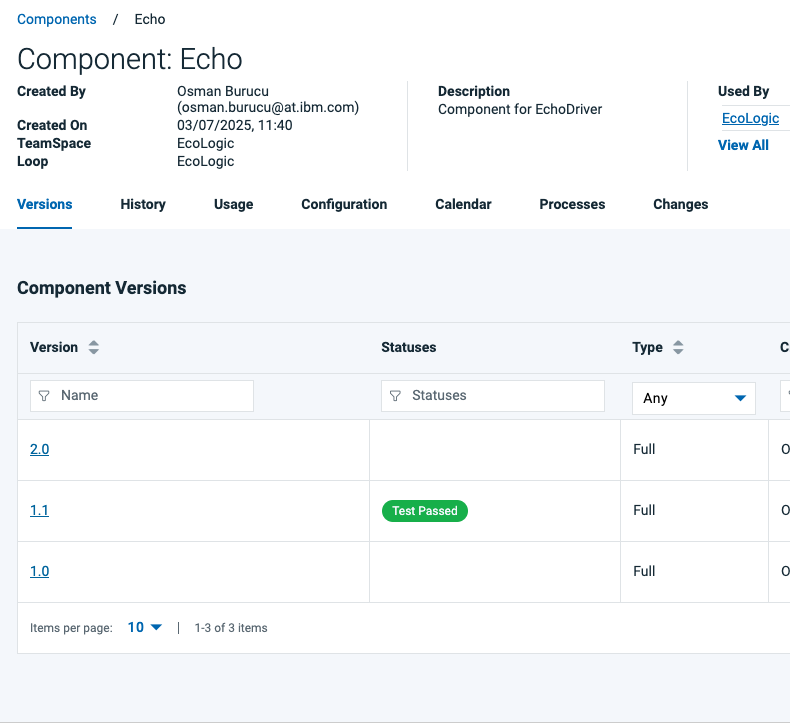
Run a Deplyoment Step Details Additional Information 1 Run a Process and view results of steps 2 Open the Applicationslist by clicking on Applications Icon 3 Click on EchoLogic Name (Link) 4 All Environments of Application will be shown 5 Run a Deployment 5.1 Use the DEV environment 5.2 click on Request Process Button: 5.3 Select Deploy with Test Passed 5.4 Uncheck Deploy Only Changed to deploy same versions again 5.5 click on Choose Component Versions button 5.6 Select the Versions of the Components for deployment 5.7 Select Version 1.1 for the Echo Component 5.8 Select Version 2.0.1 for the Logic Component 5.9 Press the Submit button to start the deployment process 6 Process is started and you can View the running Process 6.1 In this View the details of the executed steps are shown by clicking on Expand All 6.2 To view the detailed output of a step click on 3 dots menue of the step 6.3 View the output of the step 6.4 When the deplyoment finishes the Result will be shown 7 The deployment run successfully 7.1 Show Environment and its new configuration 7.2 Switch to the Environment View of the Application and view the updated configuration 7.3 Click on the Component Echo to Details 7.4 Status in the Versionlist of the component will be shown
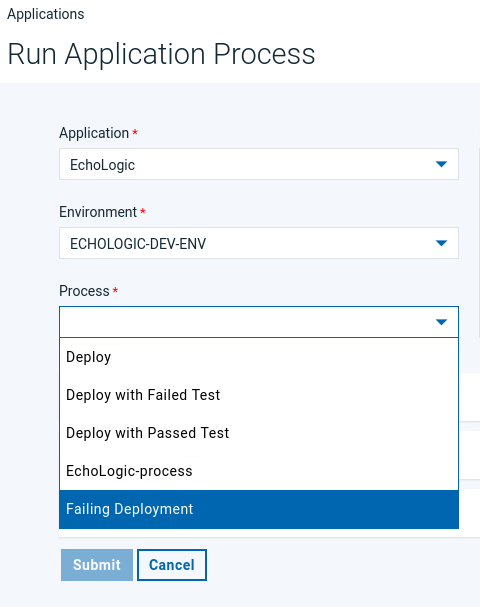
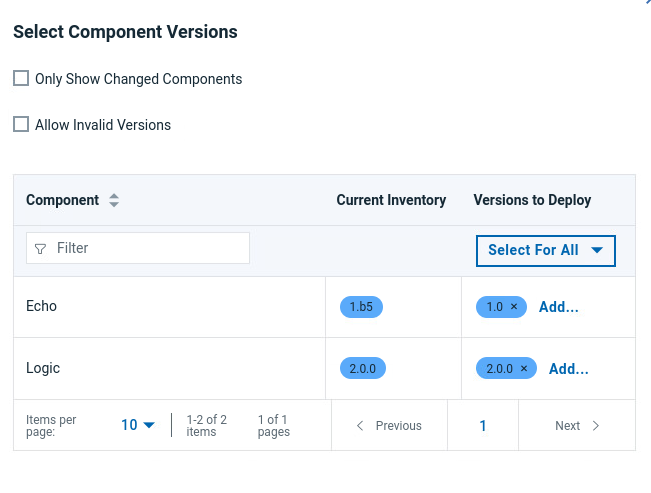
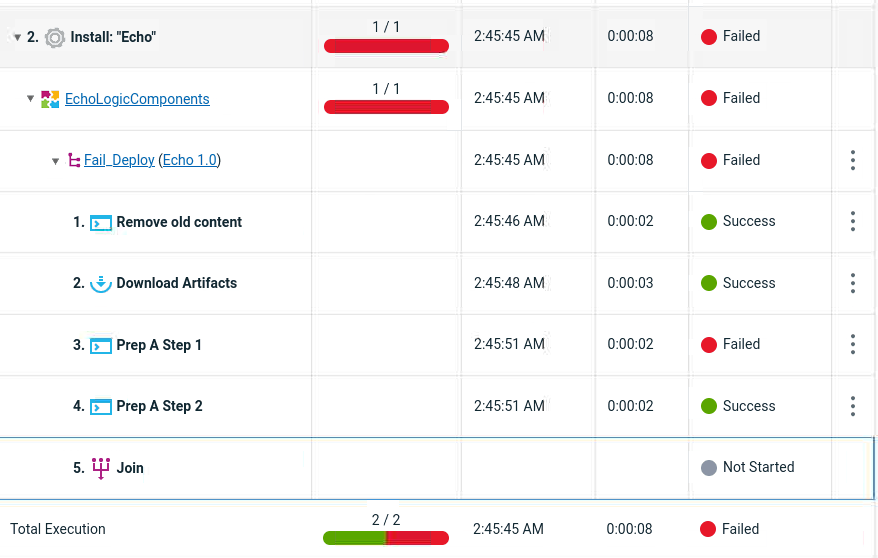
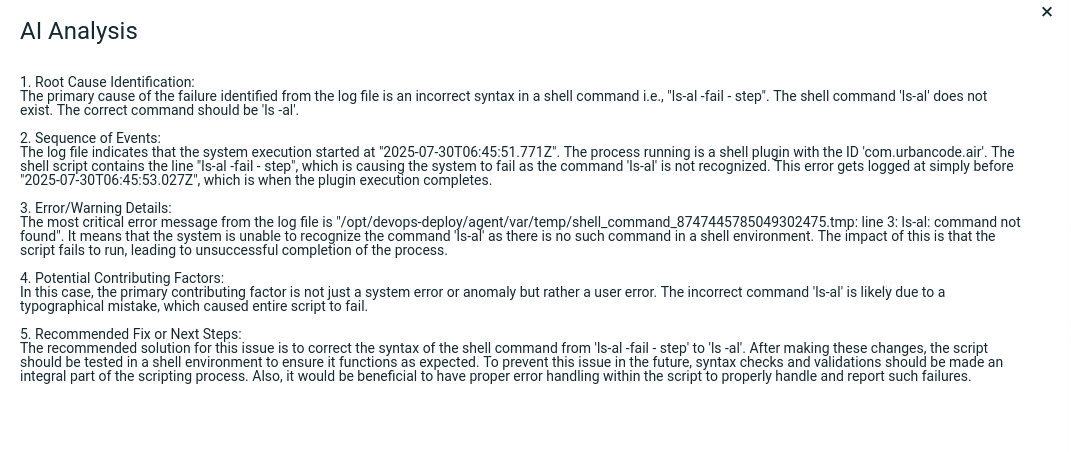
Step Details Additional Information 1 Use Deploy Genie to understand why the deployment failed 2 To simulate a failed deployment request a new deployment process but now select the following: 3 Deployment Process Failing Deployment 4 Select following Versions Echo select 1.0 Logic select 2.0.0 5 Press the Submit button to start the deployment process 6 The result will be a failed deployment as one step has failed 7 Click on the 3 dots 8 Click on Deployment Genie after a few moments the step will be analyzed and the results shown
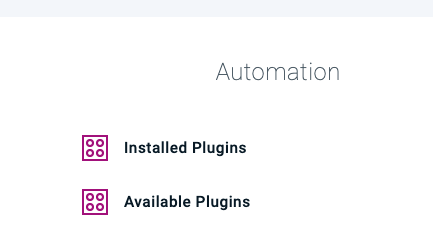
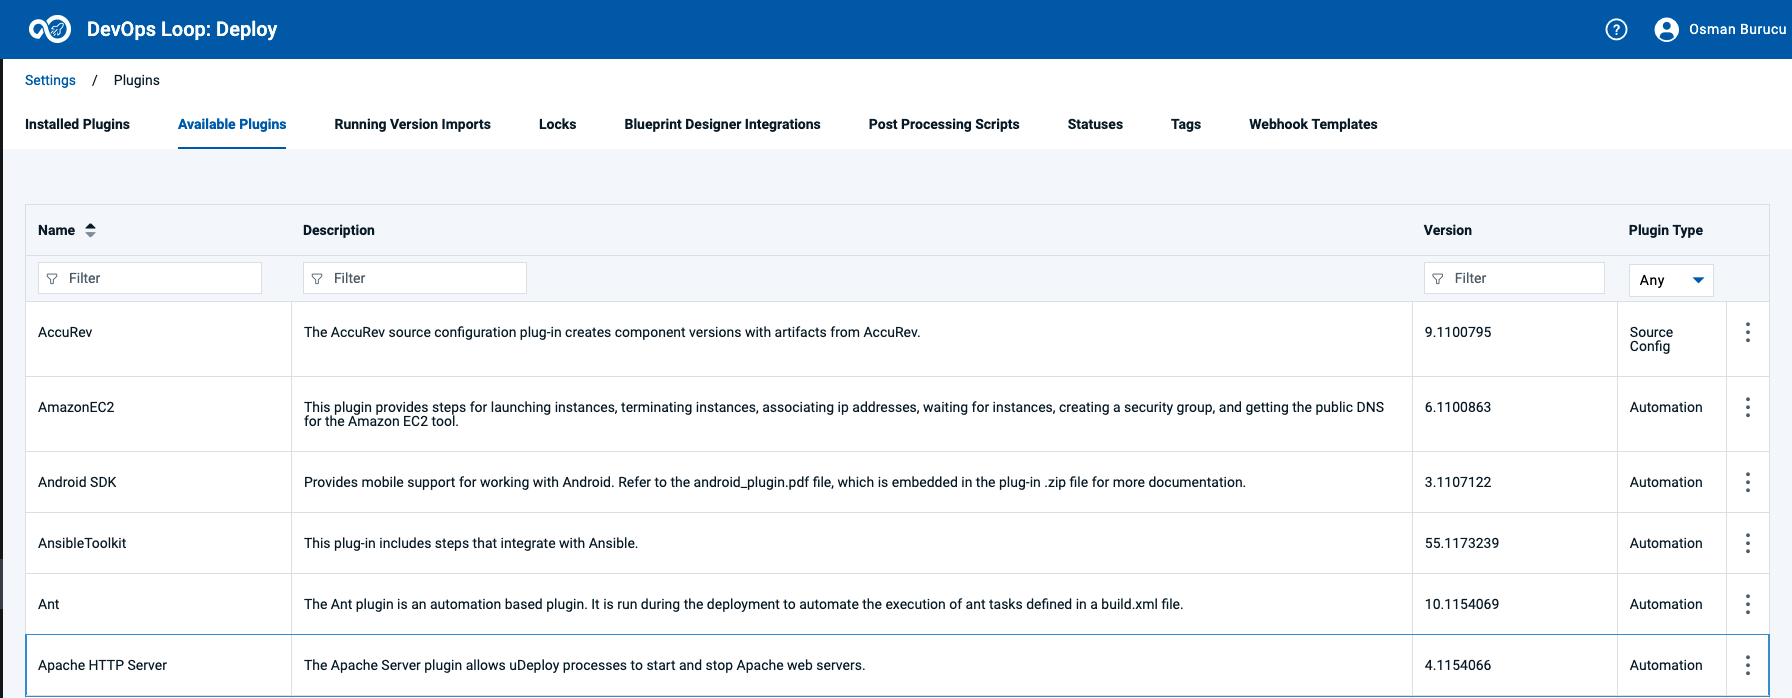
Show the Plug-Ins Page Step Details Additional Information 1 Show the plug-ins page and explain how easy it is to integrate with 3rd parties out of the box 2 Switch to Settings by using the Settings Icon 3 In the Settings View in the Section Automation View installed and available Plugins 4 By clicking on Available Plugins a list of all available Plug-Ins is shown
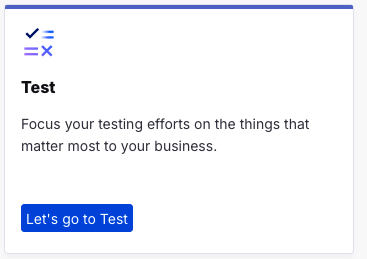
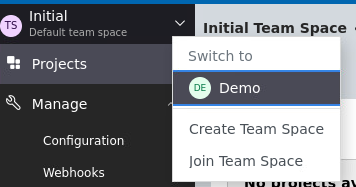
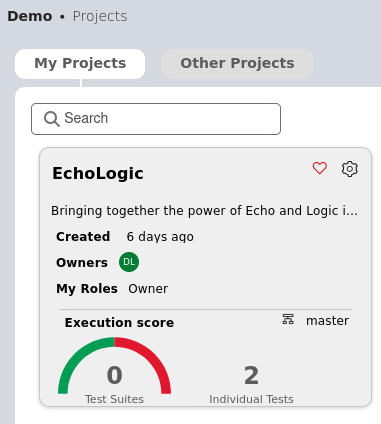
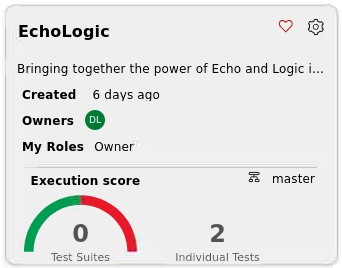
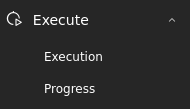
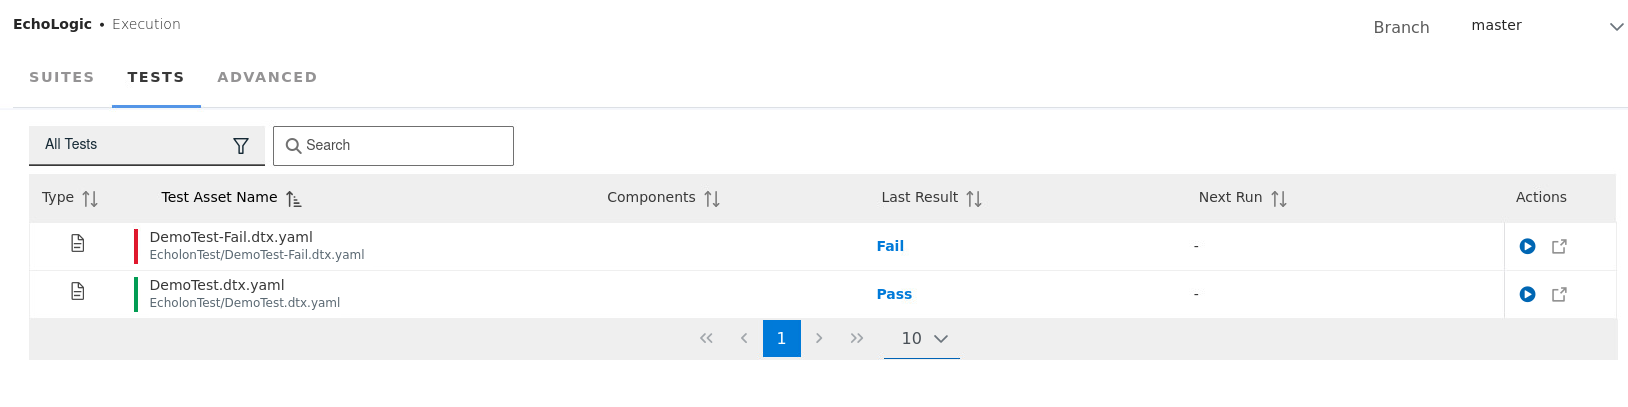
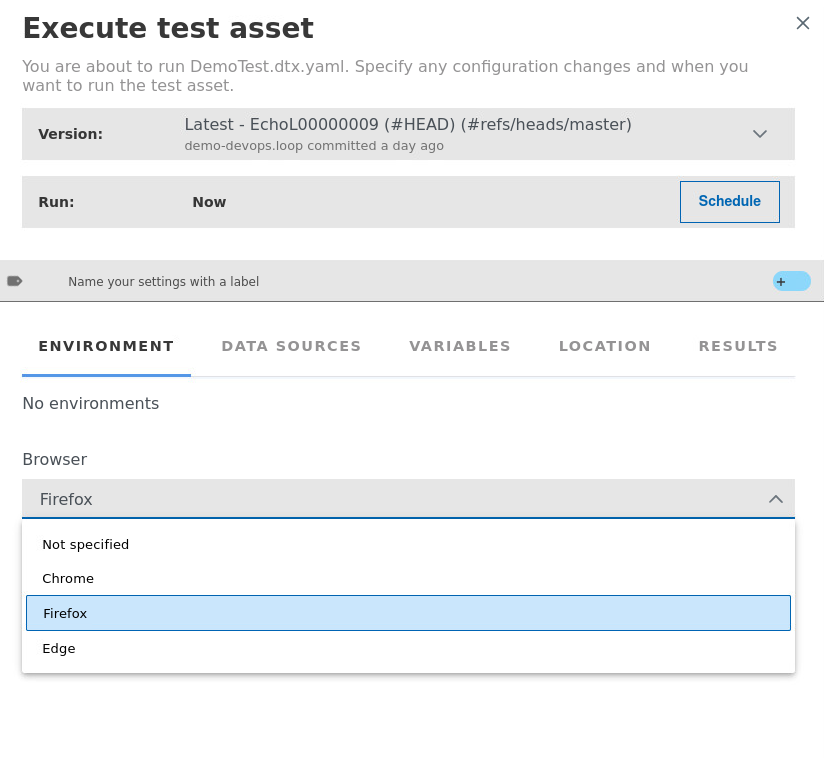
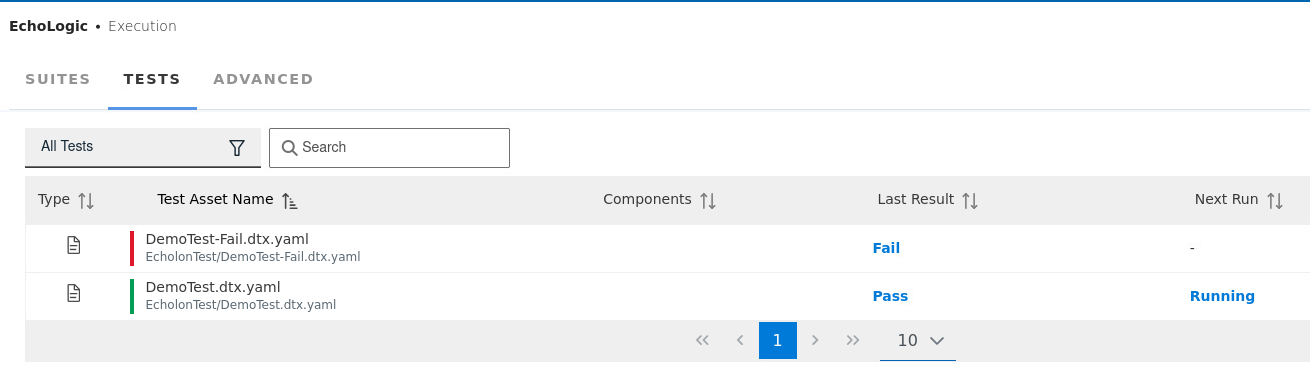
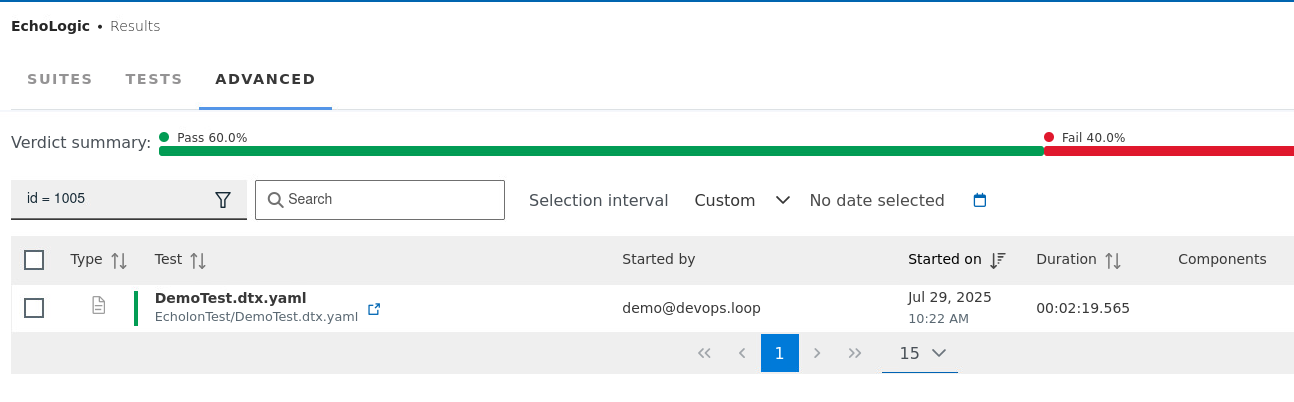
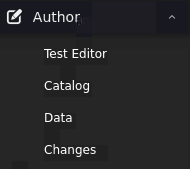
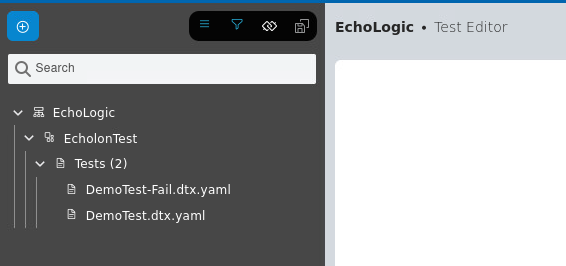
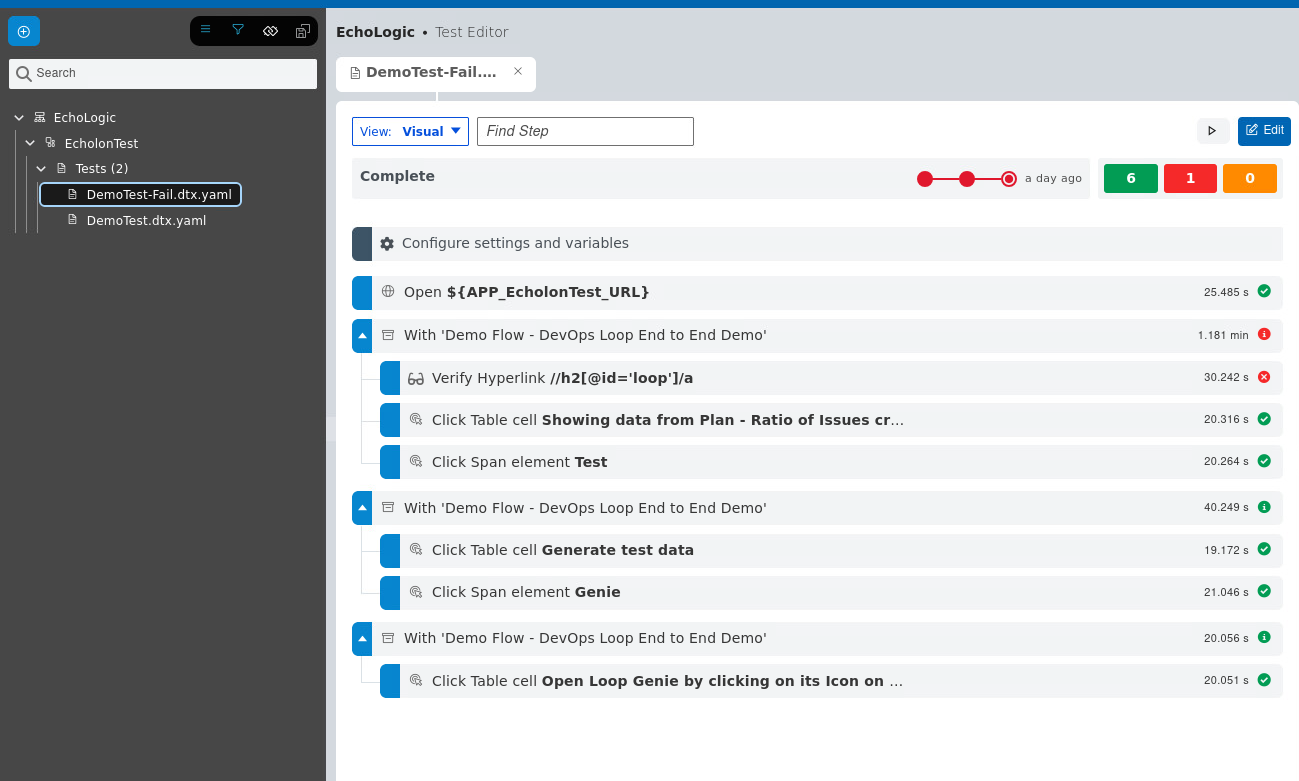
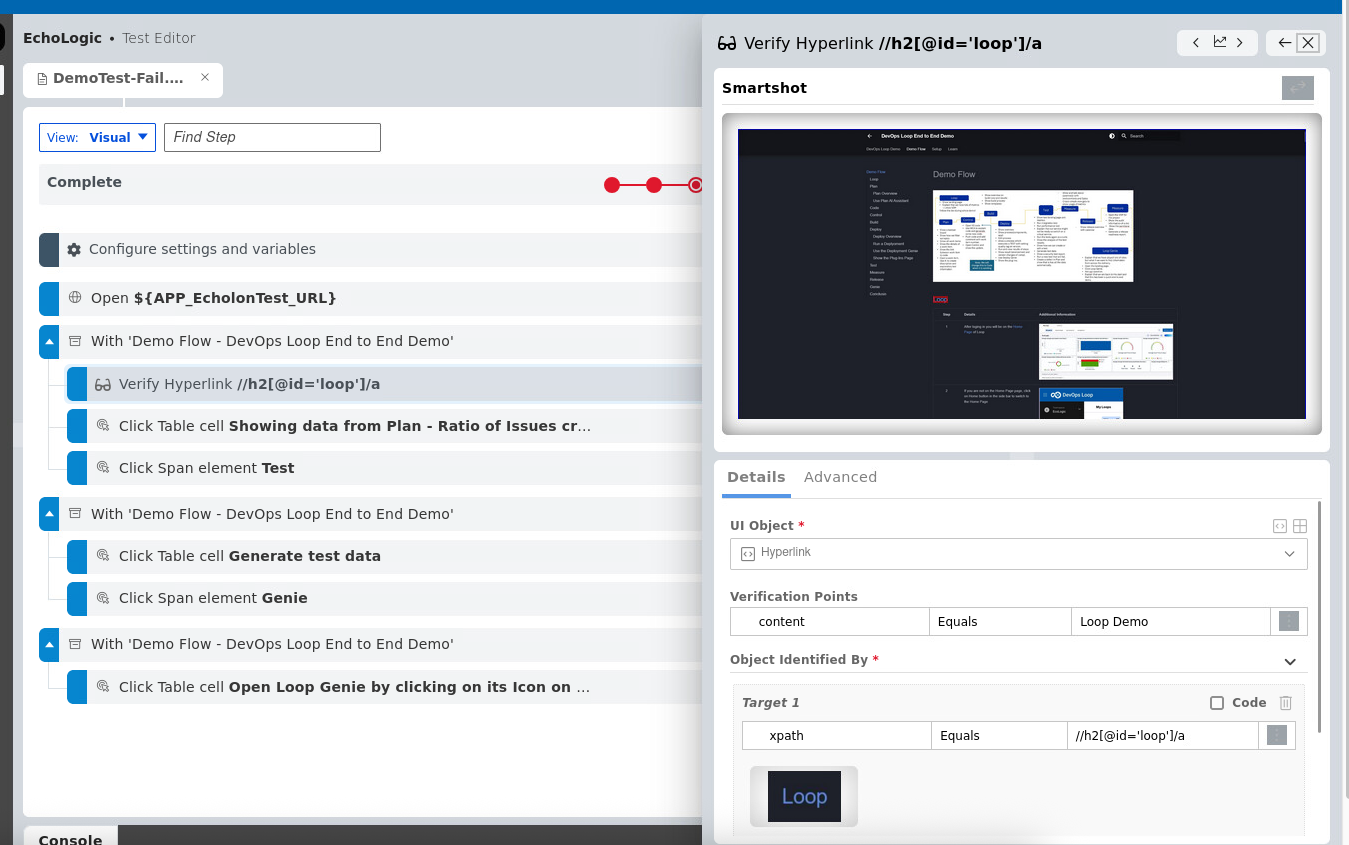
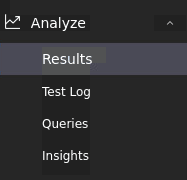
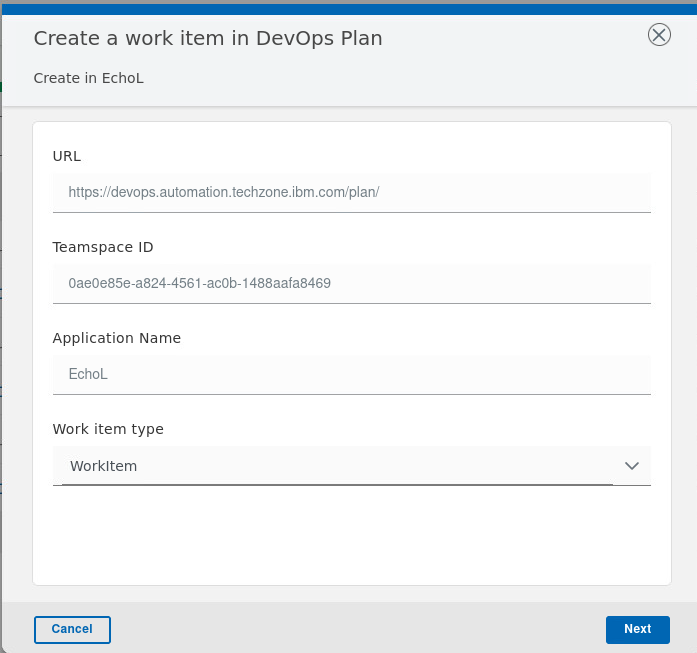
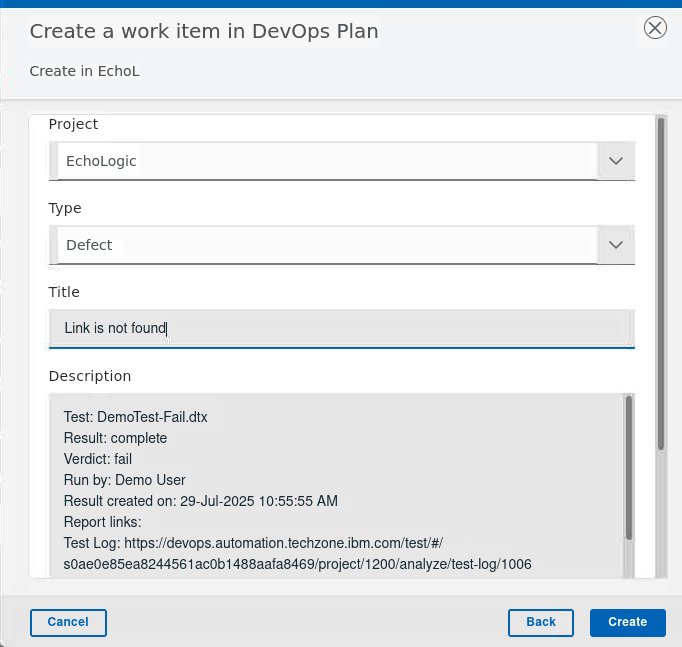
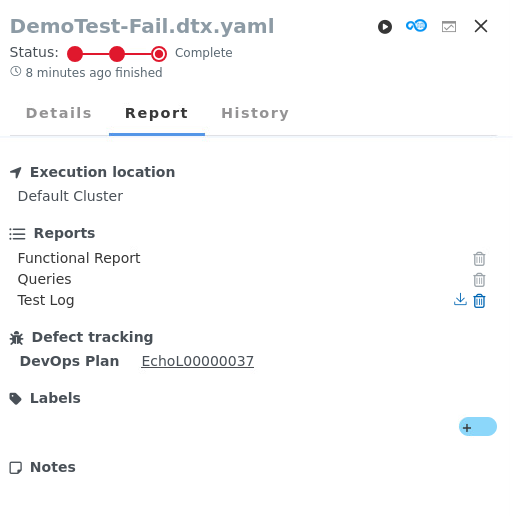
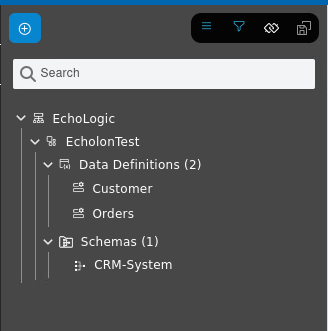
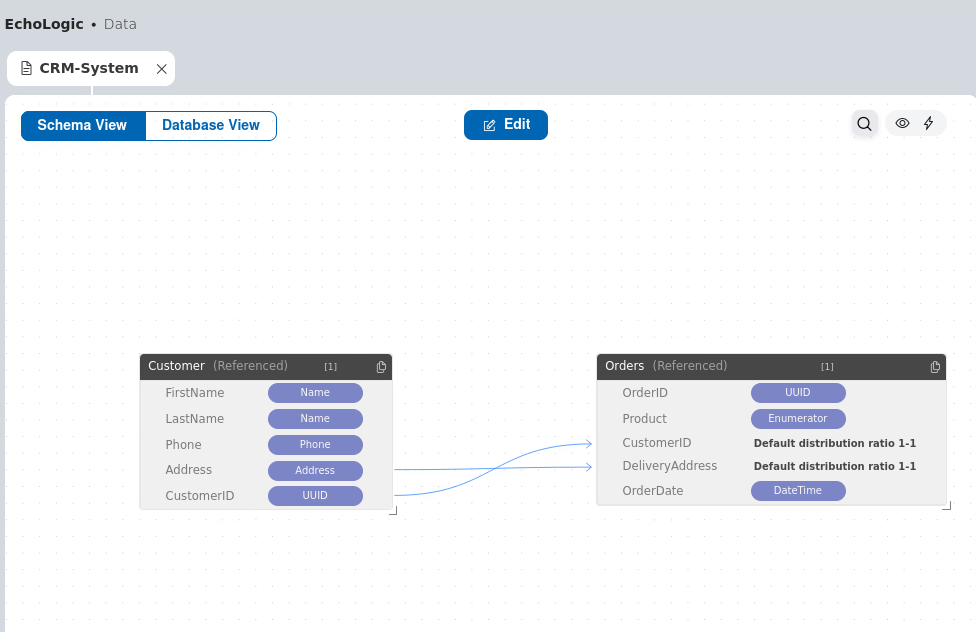
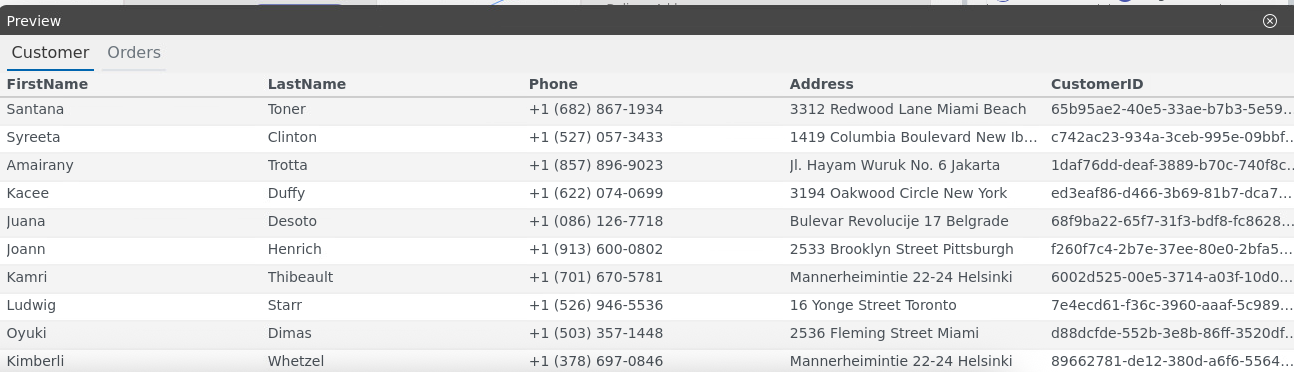
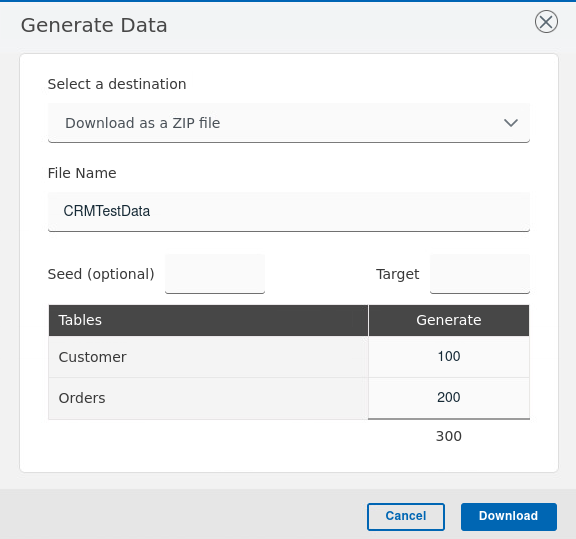
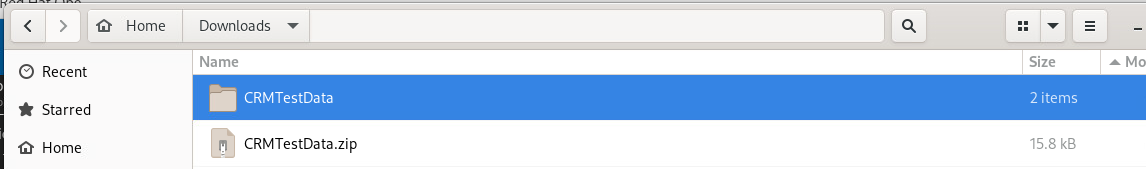
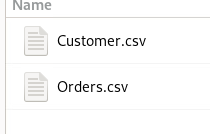
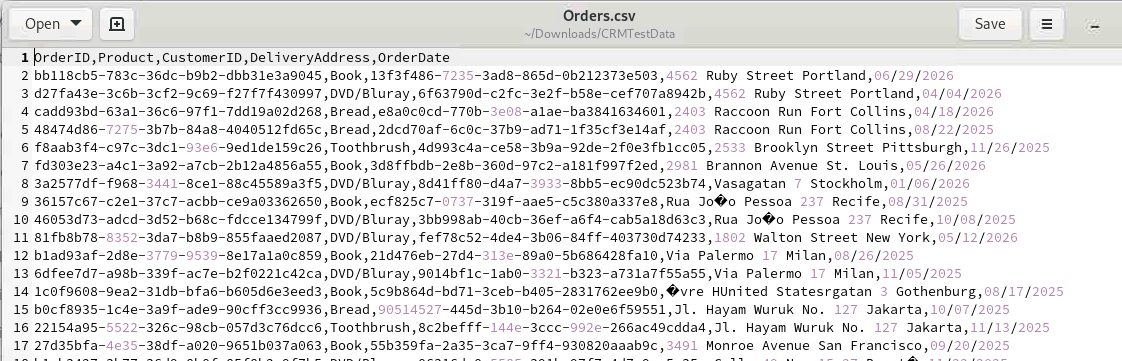
Step Details Additional Information 1 Explain that you are now playing the role of a tester 2 Open Test 2.1 You can switch to Test by either pressing "Let's go to Test" button on its tile 2.2 Or you can always switch using the central app switcher on the top left of your screen 3 Switch Teamspace and select Project if needed 3.1 Should you see a different Teamspace or Project than expected (Demo and EchoLogic), click on Teamspace Icon 3.2 and Select Demo . A list of Projects is shown: 3.3 click on EchoLogic Project to open landing page 3.4 Show the test landing page and metrics 6 Run a test 6.1 click on Execute Section in the Sidebar 6.2 List of Scripts is shown 6.3 click on Run Button on the right of Script DemoTest 6.4 Dialog is opened to select a Browser, use the default settings 6.5 Click on Execute Button to start Test Execution 6.6 Run will take a few moments 7 Show the analysis of the test results 7.1 click on Analyze section in Sidebar to get list of Menu 7.2 click on Results to get Results View 8 Show how we can create or edit a test 8.1 click on Author section on Test Editor menu entry 8.2 Test Editor View opens and select the DemoTestFail script 8.3 Test Script will be shown 8.4 click on the verification step to view step details 9 Run a new test that will fail 9.1 click on Execute Section in the Sidebar 9.2 List of Scripts is shown 9.3 click on Run Button on the right of Script DemoTestFail 9.4 Testexecution will take a few moments. 10 Create a defect in Plan and show that is has all the data automatically 10.1 Switch to Results View using the Analyze Section menu 10.2 In the Results View select the DemoTestFail run 10.3 Click on DevOps Plan 10.4 A WorkItem creation Dialog opens, select Workitem in the Type field 10.5 Select Project "EchoLogic", Workitem Type "Defect" and enter a Title 10.6 In the Results View click on the DemoTestFail name to get a Detailed View 10.7 Explain that everything is traceable 11 Generate test data 11.1 Open Author section on Test Editor menue entry and click on Data 11.2 Data Definitions and Schemas are shown 11.3 click on CRM-System in the Schema folder 11.4 the CRM-System Data Schema is shown 11.5 Click on the Preview Icon 11.6 Click on the Generate Icon 11.7 Download the generated Data by clicking on Downlad Button 11.8 Unzip and open the create folder 11.9 Two files are created Customers and Orders 11.10 Open one Orders.csv to view gnerated Data
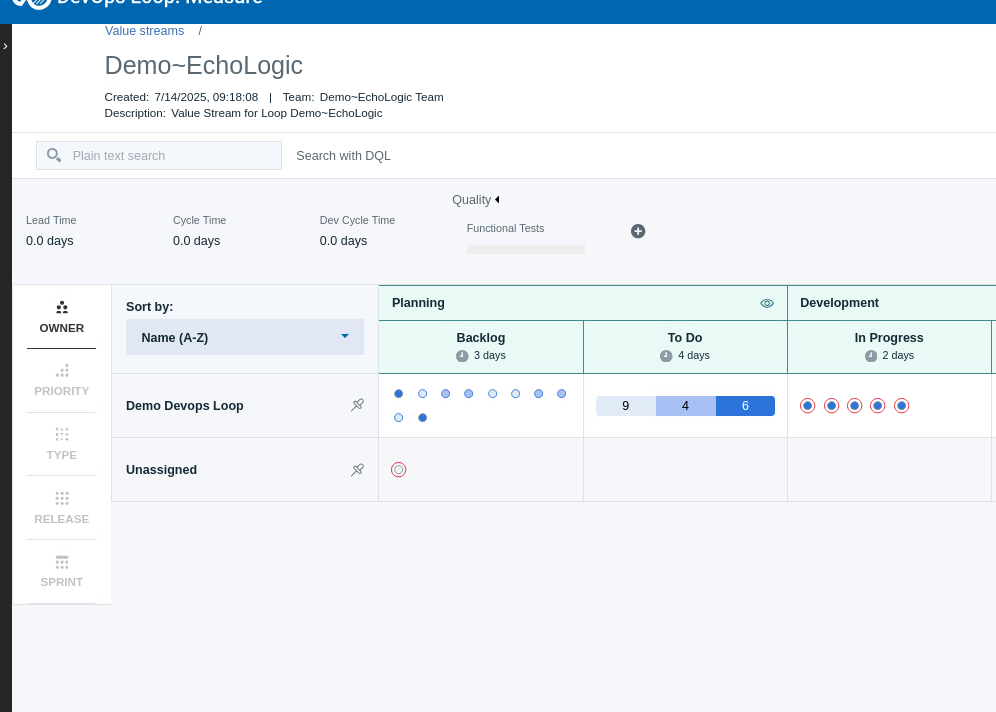
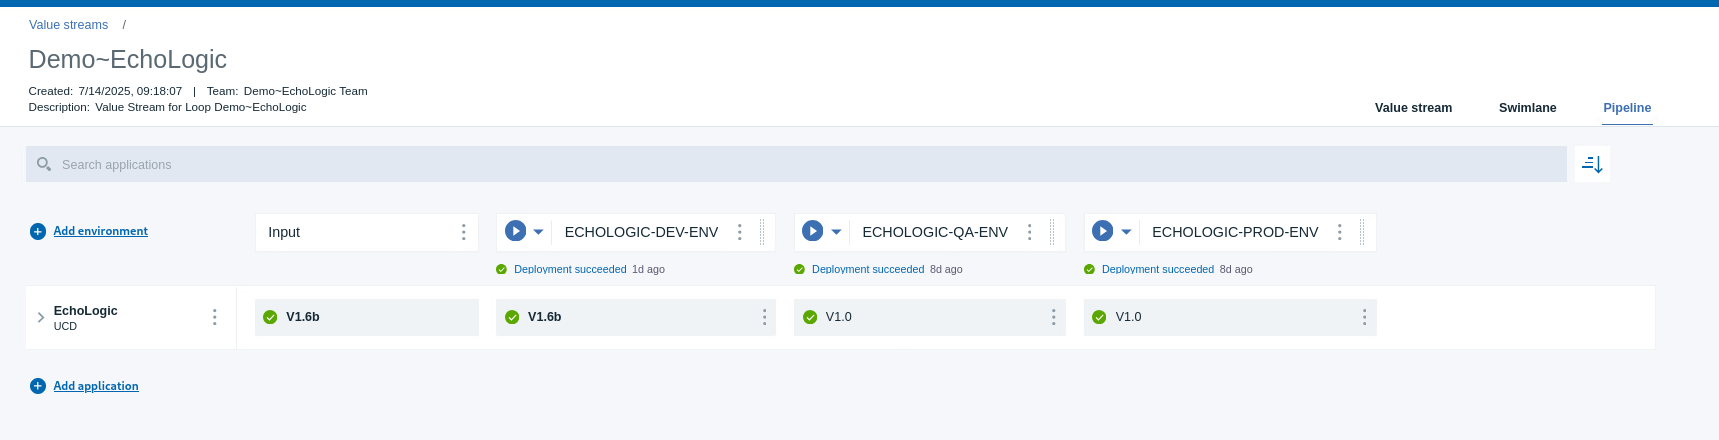
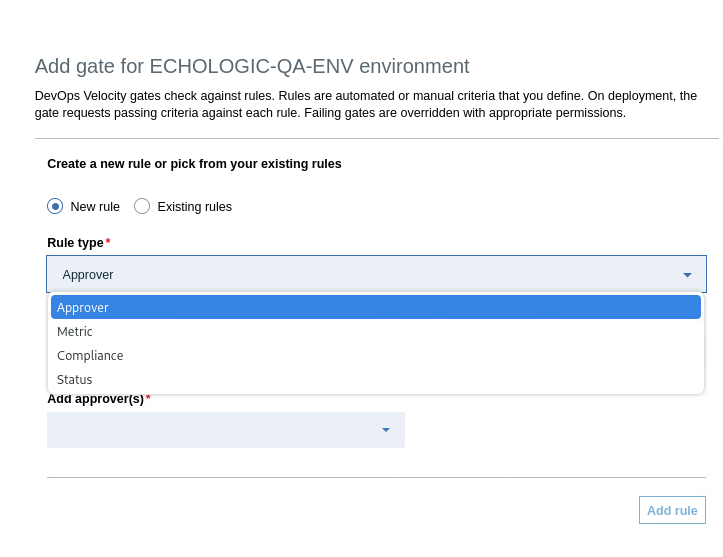
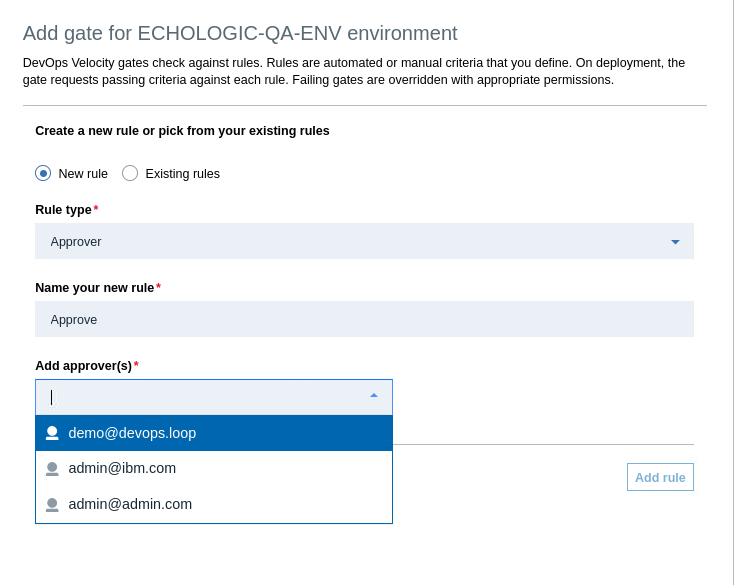
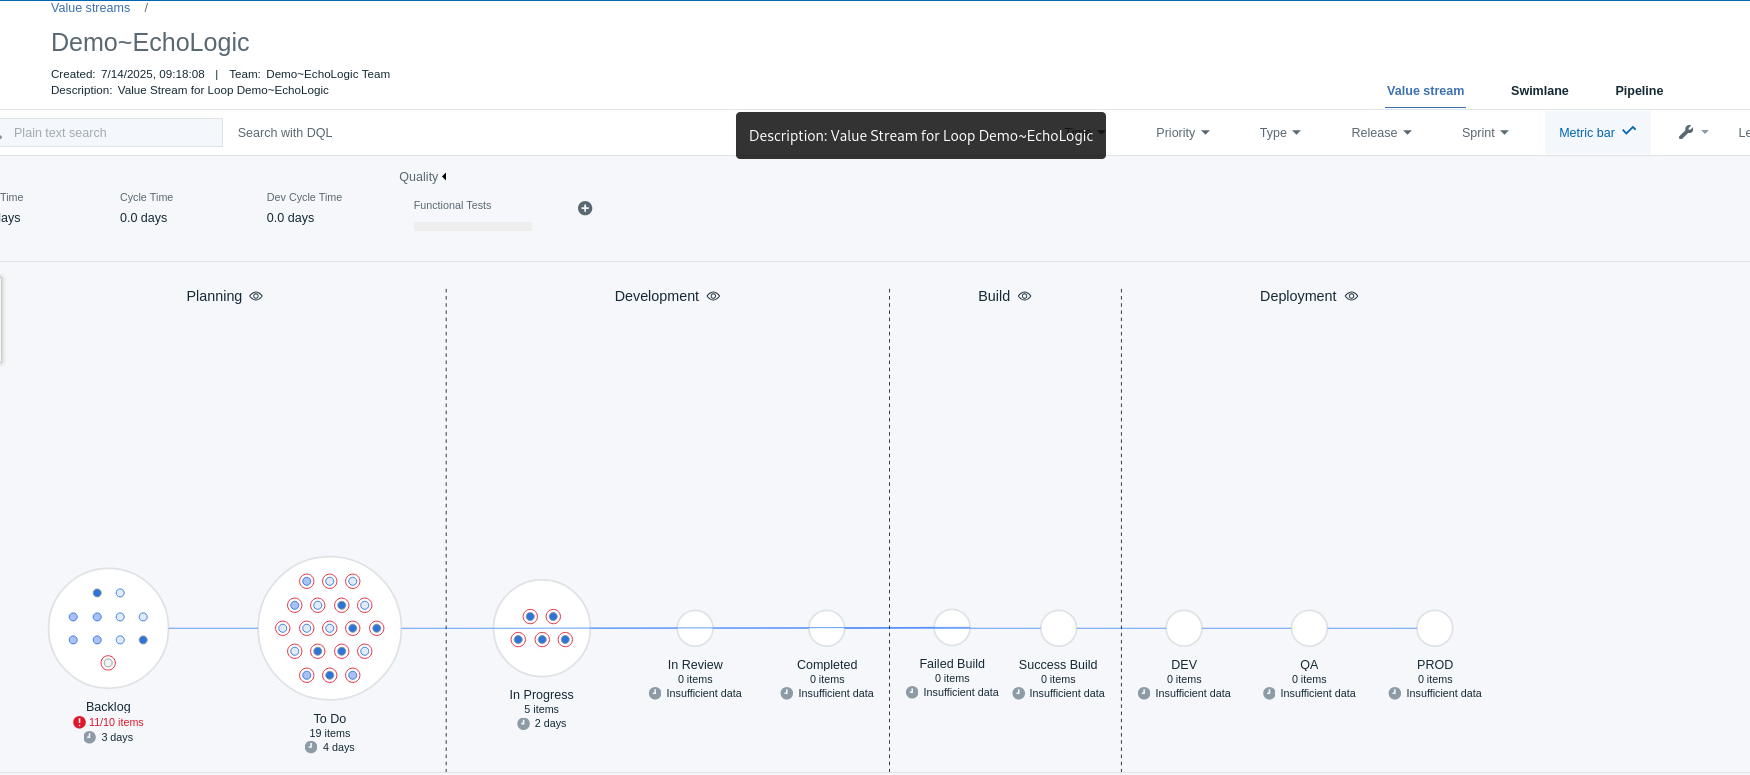
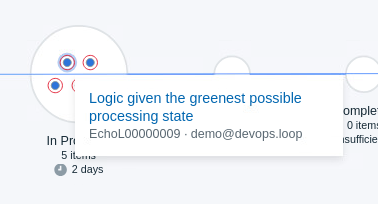
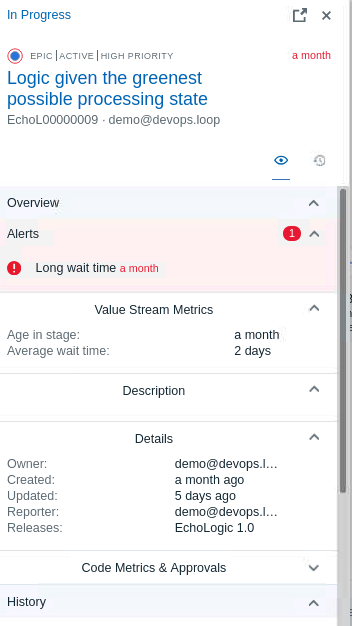
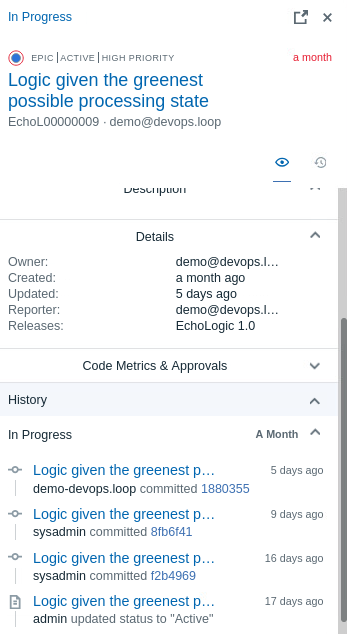
Step Details Additional Information 1 Open Measure Explain that we have built, deployed and tested so now we need to coordinate releases 2 Show and talk about pipeline(s) with environments and Gates 2.1 click on Pipelines 2.2 Delivery Pipelines linked to this VSM are shown 2.3 Create simple new Gate 2.4 click on the 3 Dots QA environment to view its menue 2.5 click on Add Gate to create an approver gate 3 Explain that we have been shoeing individual roles but we can look across roles and track the value of our delivery work 3.1 Open the VSM Value Stream in the Tabmenue 3.2 The ValueStream of EchoLogic Project is shown 3.3 click on a dot to get more information 3.4 This view will give you a complate Audit information of this item 4 click on Swimlane 4.1 The Swimlane view opens and gives more information about the distribution of items
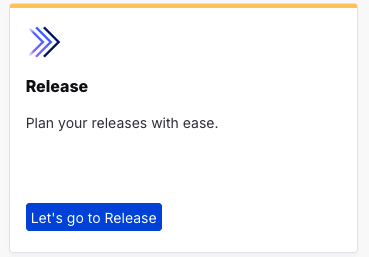
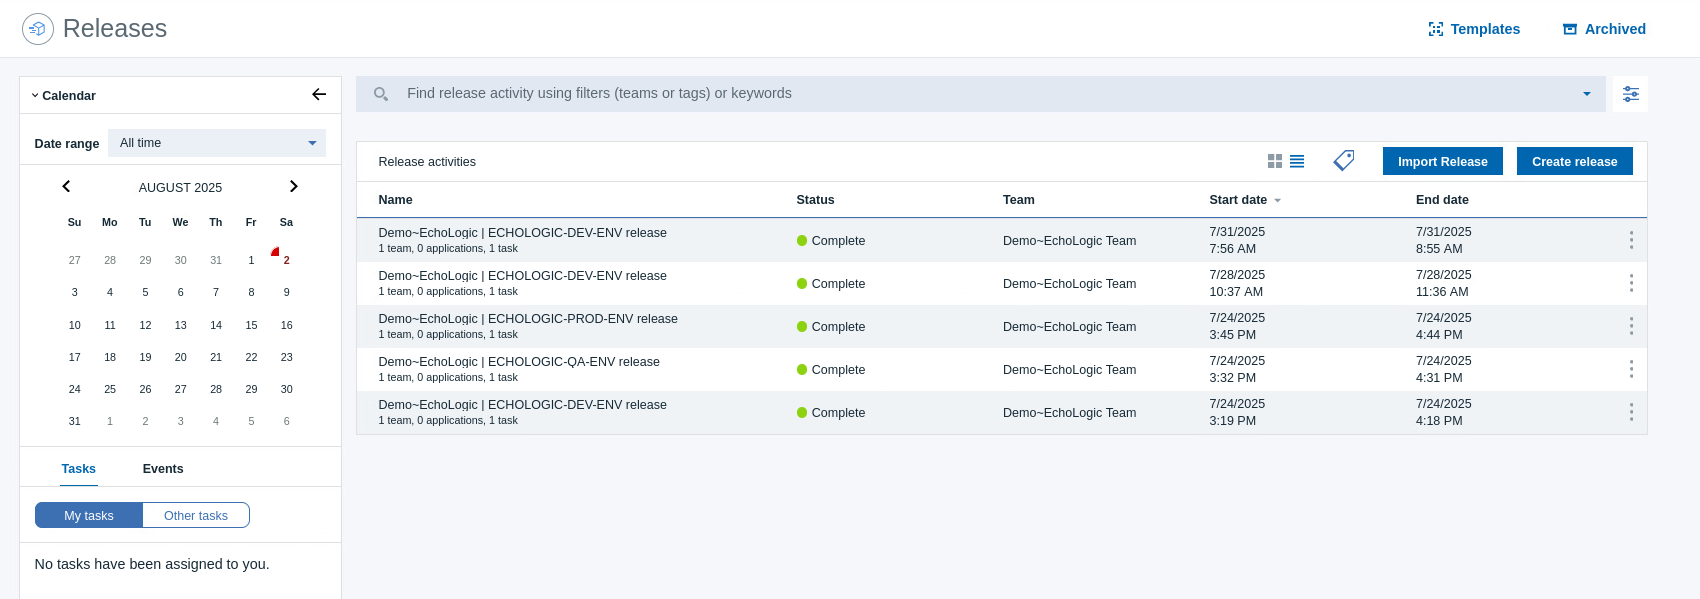
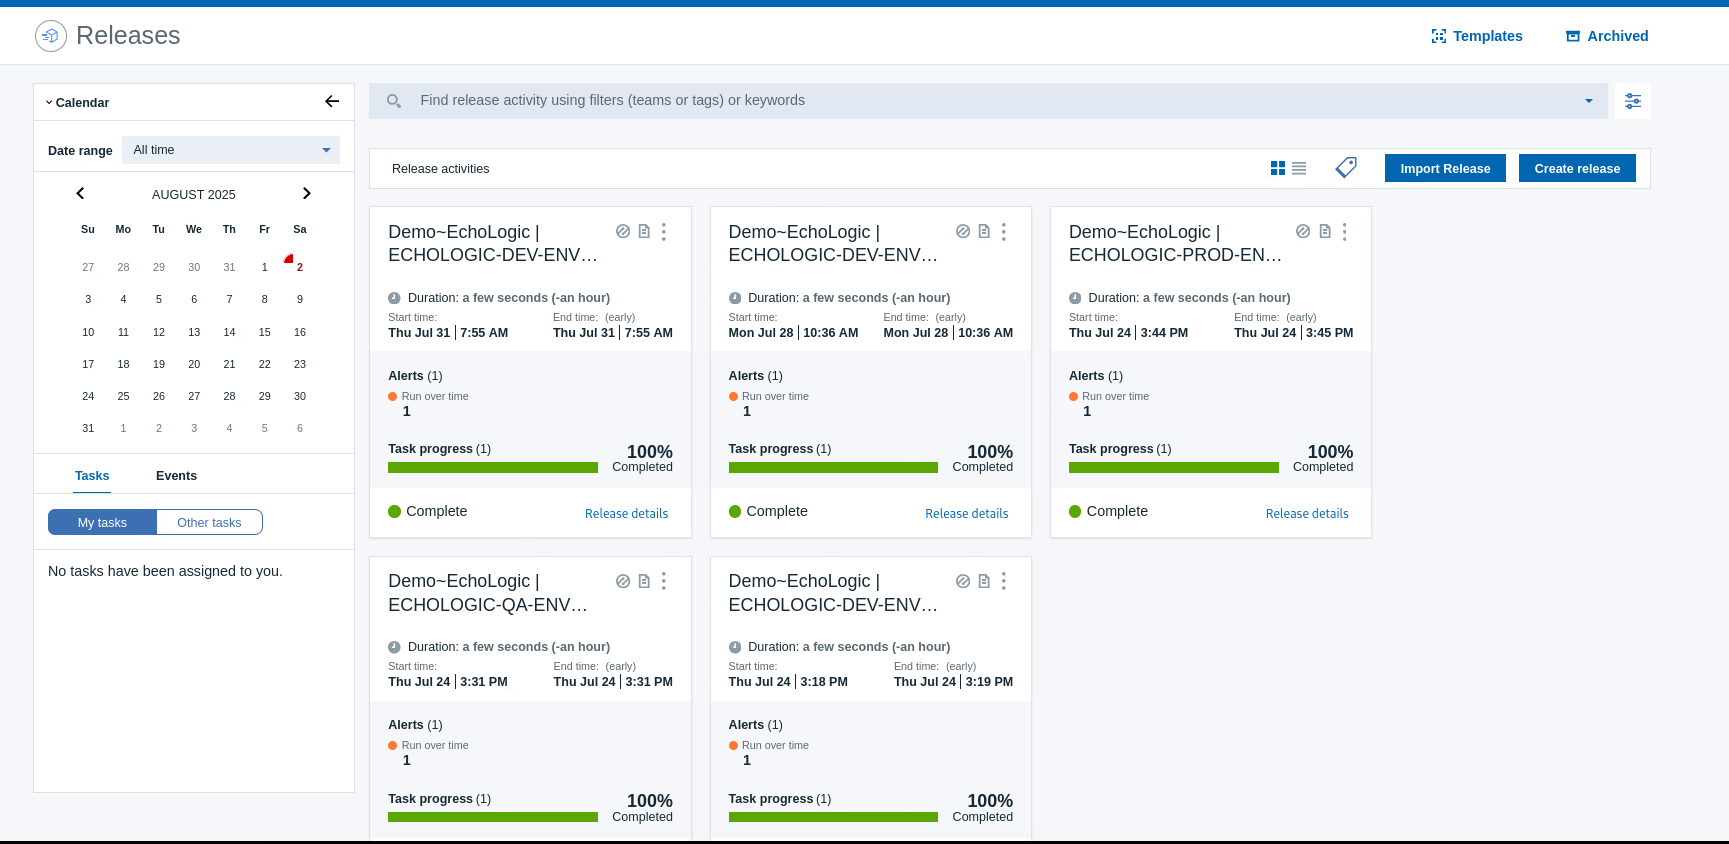
Step Details Additional Information 1 Open Release You can switch to Release by either pressing "Let's go to Release" button on its tile Or you can always switch using the central app switcher on the top left of your screen: 2 The Releases View and a Calender is shown 2.1 Switch to Tiles view by clicking on So how do we ensure everyone understands the state of our project. Well we can generate a release readiness report. – Generate the report
Explain that we have covered a lot of roles and used a mixture of AI and automation but we can bring it all together with what we call our Loop Genie
Step Details Additional Information Open Home Page Open Loop Genie by clicking on its Icon on the right side of the Dashboard Loop Genie Dialog opens Ask xyz question.
Explain that we are back to the start and that this has been a quick end to end demo


 all activities will be shown
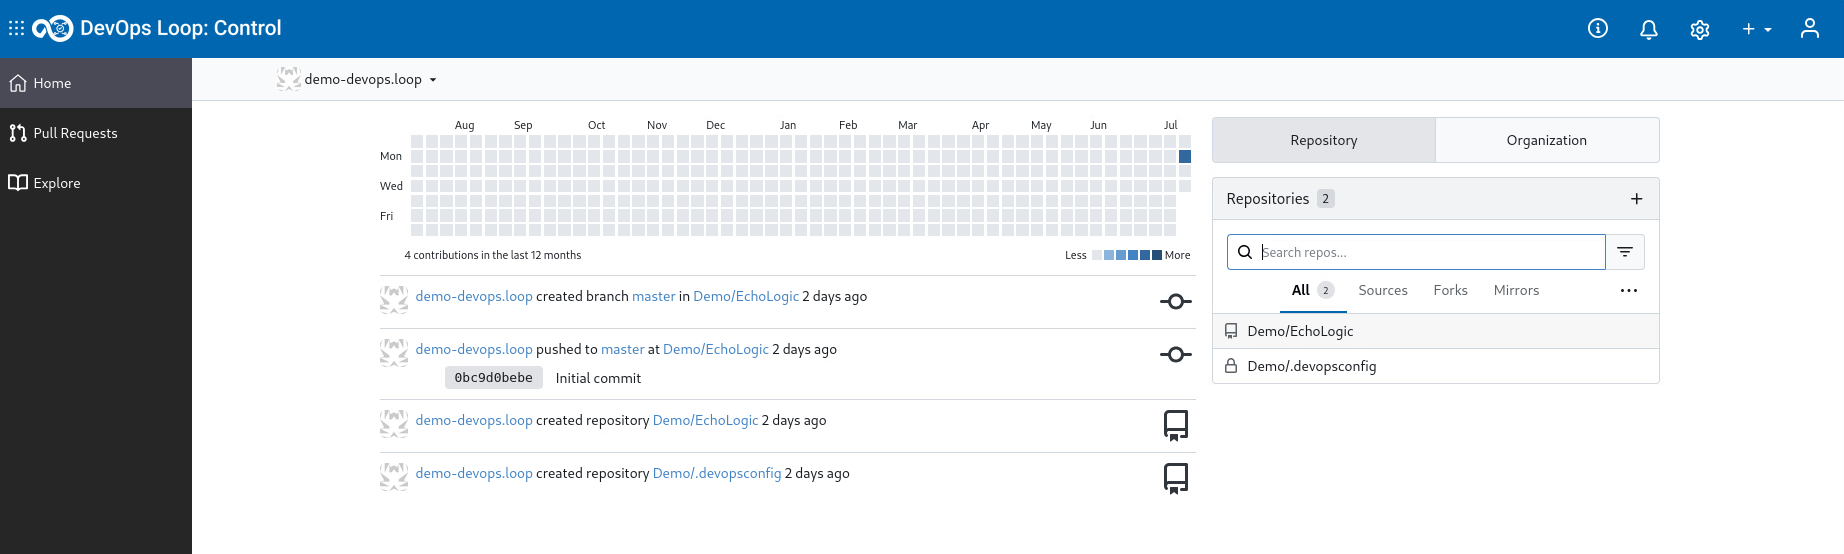
 to view all pull requests
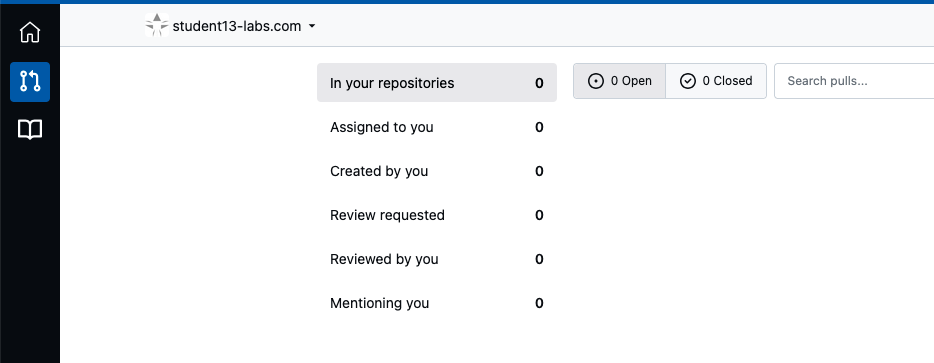
 to see all Repositories you can get access to
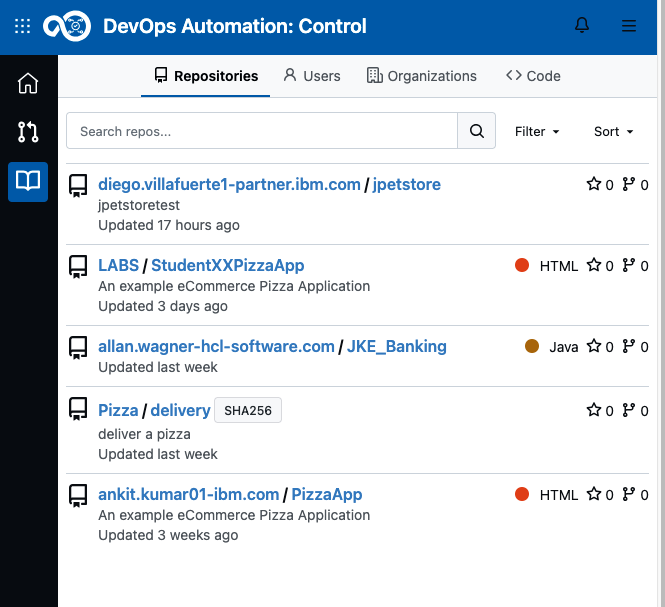
 to get an expanded Menu.
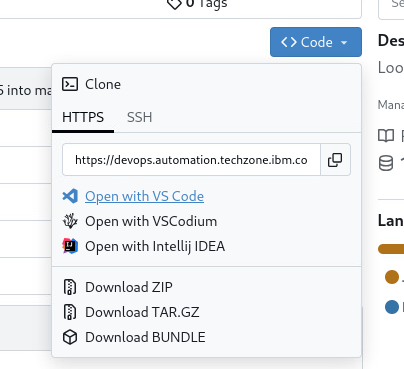


 to get menu of the failed step
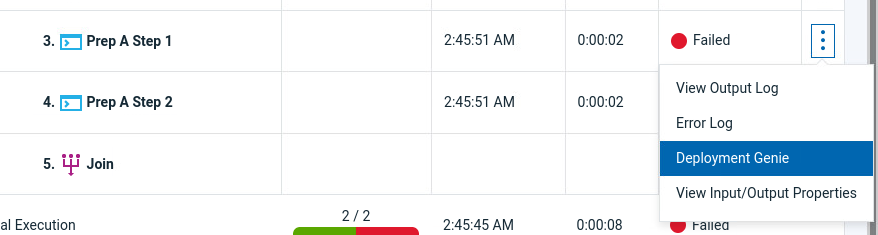


 Icon on the right side of the row


 in the Tabbar to view Pipelines
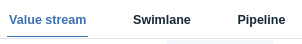
 of the QA environment to view its menue
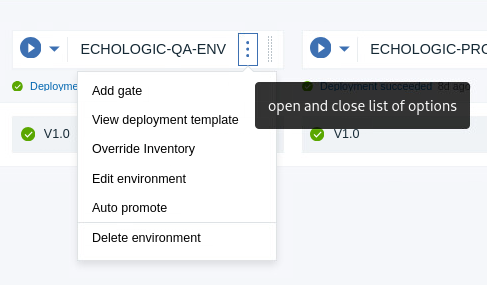
 in tabbar